



Candlestick Patterns in Trading: The Most Profitable Setups

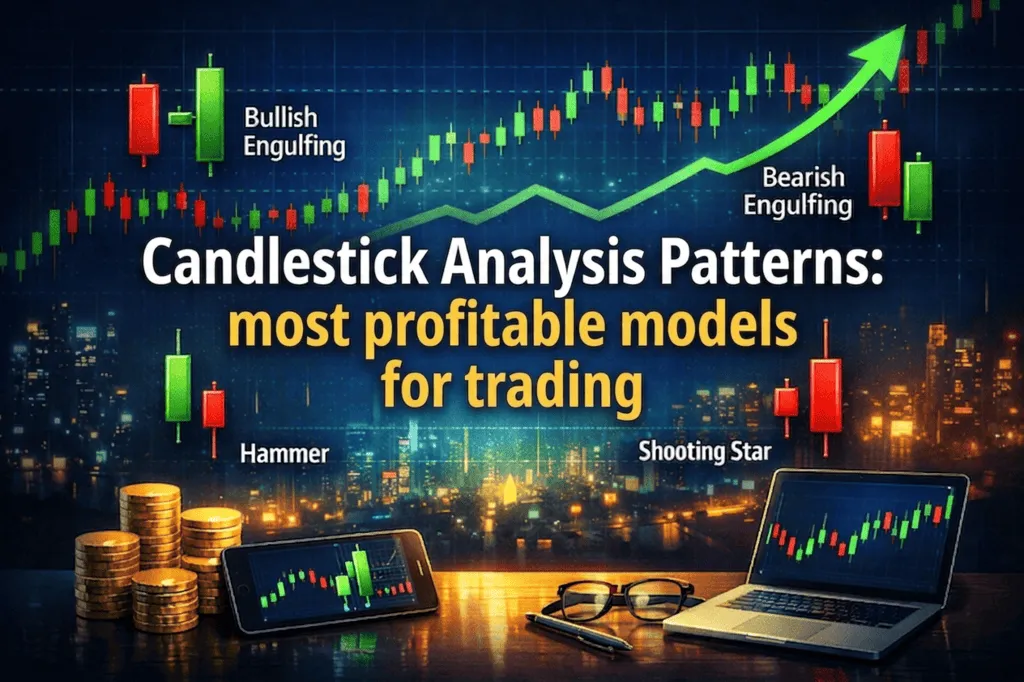
Japanese candlesticks are one of the foundational tools of technical analysis, used by traders worldwide for centuries. Every candle on a chart tells a story: where price opened, where it moved, where it closed, and how strong the pressure from buyers or sellers was. Candlestick patterns are recurring combinations of one, two, or three candles that have a high probability of signaling a reversal or continuation of a trend. This article breaks down: how candlestick patterns are built and why they work, which patterns are considered most reliable for trading crypto and Forex markets, how to correctly read the signals without falling into false-entry traps, and how to apply candlestick analysis in real trading with concrete examples and step-by-step instructions.
Understanding candlestick patterns gives a trader a critical edge — the ability to see a shift in market sentiment before most participants do. This isn’t “chart magic” — it’s reading crowd psychology through price action. A beginner who masters 10–15 key patterns can trade with far more awareness than someone blindly following indicators. From there, it’s just practice and applying the right context.
- How Japanese Candlesticks Work: The Mechanics of Candlestick Analysis
- The Most Profitable Candlestick Patterns: A Breakdown by Group
- How to Read Candlestick Patterns: A Step-by-Step Guide for Traders
- Comparing Candlestick Patterns: Reliability and Application
- Risks and Mistakes When Using Candlestick Analysis
- Candlestick Pattern Effectiveness Statistics for Traders
- Candlestick Analysis: Current Trends and Changes
- Conclusion: Using Candlestick Patterns Effectively
How Japanese Candlesticks Work: The Mechanics of Candlestick Analysis
The candlestick chart originated in Japan back in the 18th century — invented by rice trader Munehisa Homma. He noticed that rice prices were driven not just by supply and demand, but by the emotions of market participants. That’s how a tool was born that, three centuries later, became the standard for technical analysis across every financial market.
Every candle consists of four key values: the open price, the close price, the high, and the low for the chosen period. The candle’s body — the rectangular part — shows the distance between the open and close prices. If the close is higher than the open, the candle is bullish (usually green or white). If the close is lower than the open, the candle is bearish (red or black). The upper wick stretches from the body to the period’s high, and the lower wick stretches from the body to the low.
The candle’s body tells you who controlled the market for most of the period. A long body means a strong move in one direction; a short body means participant indecision. A long lower wick with a short body means: sellers tried to push the price down, but buyers seized the initiative. That’s the basis for reading the “Hammer” pattern — one of the most reliable reversal signals.
Candlestick patterns work because they reflect a genuine psychological shift in crowd behavior. When a “Morning Star” combination forms after an extended downtrend, it means sellers are losing control, buyers are starting to seize the initiative, and the odds of a reversal rise sharply. A trader’s job isn’t just to recognize the shape — it’s to understand what’s driving it.
Reversal patterns appear after a pronounced trend and signal its end. Continuation patterns form during a consolidation period and indicate that the price move will resume in its previous direction. A separate group covers indecision patterns — doji candles and highly volatile candles with long wicks — which signal a balance of power between buyers and sellers.
A candlestick pattern’s reliability depends on several factors: the timeframe (signals are stronger on daily and weekly charts than on minute charts), trading volume (high volume confirms a pattern’s authenticity), a support or resistance level (a pattern at a key level matters more than one in the middle of a channel), and confirmation from the next candle — especially for two- and three-candle combinations.
The Most Profitable Candlestick Patterns: A Breakdown by Group

Bullish Reversal Patterns at the Bottom
Hammer
One of the best-known reversal patterns. It forms at the bottom of a downtrend: a short body in the upper part of the range, a long lower wick (at least twice the body’s length), and a minimal or absent upper wick. This tells you: sellers pushed price down first, but by the close, buyers had recovered most of the move. The pattern signals a possible reversal into an uptrend.
Bullish Engulfing
A two-candle pattern. The first candle is red; the second is green and completely covers the body of the first. The pattern says: buyers didn’t just stop the sellers — they fully absorbed their move. The larger the second candle, the stronger the signal. It’s especially reliable at support levels and after an extended decline.
Morning Star
A three-candle combination. The first candle is a long bearish one; the second has a small body (often a doji); the third is a long bullish green candle that closes above the midpoint of the first candle’s body. This is a classic downtrend-reversal signal. The pause represented by the second candle shows: selling pressure has weakened, and buyers are starting to dominate.
Bearish Reversal Patterns at the Top
Evening Star
The mirror image of the Morning Star: three candles, where the first is a long bullish one, the second has a small body, and the third is a long red candle covering a significant portion of the first candle’s body. It appears after an uptrend and warns of its end.
Three Black Crows
Three consecutive red candles with progressively lower open and close prices. This is a powerful signal of a downtrend continuation or a reversal confirmation. Each candle opens within the body of the previous candle and closes lower. The pattern demonstrates systematic selling pressure across several periods.
Bearish Engulfing
The mirror of the bullish version: a red candle completely covers the body of the previous green one. The bigger the size gap between the candles, the more aggressive the bearish signal. The pattern becomes significant at resistance levels and after a prolonged rally.
Trend-Continuation Patterns
Three White Soldiers
Three consecutive green candles with rising open and close prices. The candle bodies are long, wicks short. This pattern signals sustained buying pressure and a high probability of trend continuation. It’s especially reliable when it appears after a period of consolidation or correction.
How to Read Candlestick Patterns: A Step-by-Step Guide for Traders
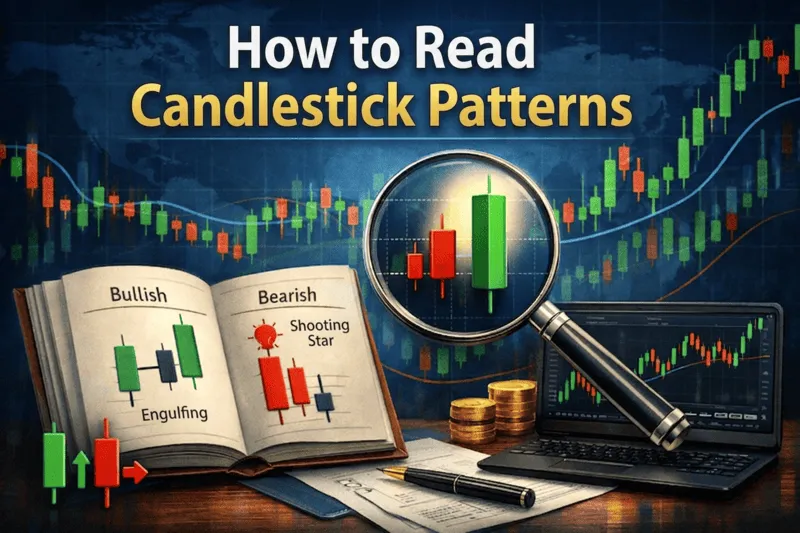
You can master candlestick analysis in 2–4 weeks with regular practice. The key isn’t memorizing every existing pattern (there are more than a hundred) — it’s learning to read market logic through a handful of proven ones. Below is a concrete path from theory to real trading.
Step 1. Choose a trading platform with proper candlestick charts.
TradingView is the standard for most traders: the free version gives you access to a full analysis toolkit. Set your display to Japanese candlesticks, not bars or lines. A common beginner mistake is analyzing patterns on line charts, where all the information about wicks gets lost.
Step 2. Start by studying 5–7 basic patterns.
Hammer, Inverted Hammer, Bullish and Bearish Engulfing, Doji, Morning and Evening Star. Don’t try to cover everything at once. Drill each pattern until it’s automatic: what it looks like, what it means, and under what condition you should trade it. For each pattern, log 10–15 historical examples from the chart in your trading journal.
Step 3. Add context — support and resistance levels.
A pattern appearing in a vacuum is significantly less reliable than one appearing at a key level. Use horizontal levels, volume zones, and trend lines. When a green engulfing candle forms right at a support level, that’s double confirmation: both structural and candlestick-based.
Step 4. Wait for confirmation.
The main mistake is entering a trade immediately after a pattern forms, without waiting for a confirming candle. After a Hammer appears, wait for the next candle to close above its high. After a Bullish Engulfing, check that the next candle doesn’t reverse downward. Confirmation reduces the frequency of false signals.
Step 5. Define your entry point, stop-loss, and take-profit before opening the trade.
A stop-loss when trading a Hammer sits below its lower wick (below the pattern’s low). Your take-profit is the nearest resistance level, or a risk/reward ratio of at least 1:2. If a signal doesn’t offer a reasonable risk/reward ratio, skip it.
Step 6. Choose the right timeframe.
On the daily and 4-hour chart, signals are more reliable but less frequent. On the hourly and 15-minute chart, there are more signals, but lower quality. Beginners are advised to start with the daily chart: each pattern forms slowly, giving you time to think through the trade, with less chance of an emotional decision.
Step 7. Keep a trading journal.
Log every pattern you spot: date, asset, timeframe, pattern type, entry point, and outcome. After 50–100 trades, you’ll have real data: which patterns work on your instruments, on which timeframes, and under which market conditions.
Comparing Candlestick Patterns: Reliability and Application
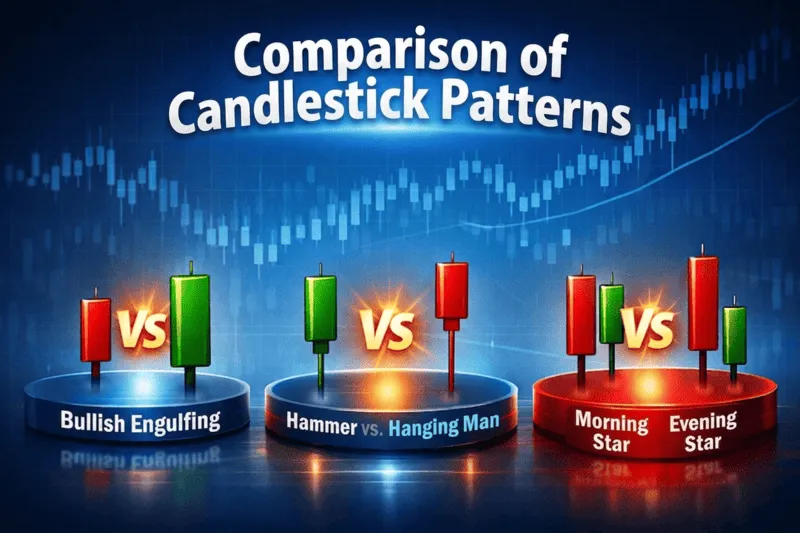
Not every candlestick pattern is equally useful. Below is a comparison table of key patterns by signal accuracy, identification difficulty, and applicability across different markets. The data is based on statistical research and trader practice.
| Pattern | Signal Type | Reliability | Timeframe | Market | Difficulty |
|---|---|---|---|---|---|
| Hammer / Inverted Hammer | Reversal (bullish) | 65-70% | D1, H4 | Crypto, Forex, Stocks | Low |
| Bullish/Bearish Engulfing | Reversal | 68-75% | D1, H4, H1 | All markets | Low |
| Morning / Evening Star | Reversal | 70-78% | D1, W1 | Forex, Stocks | Medium |
| Three White Soldiers / Three Black Crows | Continuation | 62-68% | D1, W1 | Stocks, Crypto | Medium |
| Doji (several types) | Indecision | 55-65% | Any | All markets | Low |
| Harami (bullish/bearish) | Reversal (weak) | 55-62% | H4, D1 | Forex, Crypto | Medium |
| Shooting Star | Reversal (bearish) | 63-70% | D1, H4 | All markets | Low |
| Hanging Man | Reversal (bearish) | 58-65% | D1 | Forex, Stocks | Low |
The Morning Star and Evening Star patterns deliver the most reliable signals thanks to their three-candle structure — several periods are needed to form them, which reduces the share of random coincidences. Bullish Engulfing works across every market and timeframe, making it one of the most versatile tools for short- and medium-term trading. A doji by itself doesn’t give a trading signal — it’s an indecision candle, and it needs to be analyzed only in the context of the preceding trend and neighboring candles.
For crypto markets, with their high volatility, patterns with long wicks — Hammer, Inverted Hammer, Shooting Star — are especially relevant. They often form during liquidity manipulation, when price spikes sharply beyond a level and returns back inside. On the Forex market, where moves are smoother, two- and three-candle combinations like Engulfing and Star patterns work better.
Risks and Mistakes When Using Candlestick Analysis
1. Trading Patterns with No Context
A “Hammer” pattern on the hourly chart in the middle of a range isn’t a trading signal. A pattern only gains meaning within context: after a pronounced downtrend, near a support level, ideally with elevated volume. Traders who buy every single Hammer they see run into a string of losing trades precisely because they ignore market context.
2. No Confirmation
Entering a trade the moment a pattern finishes forming is a common beginner mistake. The market often produces “false” patterns, especially on lower timeframes. One way to reduce this risk is waiting for the next candle to close in the expected direction. Yes, your entry price will be slightly worse, but your win rate will rise.
3. Overestimating a Pattern’s Reliability
Even the most accurate candlestick patterns — Bullish Engulfing, Morning Star — work with a probability of 70-75%, no higher. That means one in every four trades will be a loser, even with perfect rule adherence. Traders who treat a pattern as a guarantee skip stop-losses or increase their position size. The result: a few large losses wipe out every previous gain.
4. Ignoring the Macro Context
Candlestick patterns reflect short-term market psychology, but they don’t account for fundamental factors. A Bullish Engulfing on Bitcoin on the day of a bad macroeconomic data release or a hard fork can turn out to be a trap: large players use technical levels to exit positions. Before entering, check the economic calendar and news around the asset.
5. Working on Just One Timeframe
A pattern that looks great on the H1 chart might just be a correction inside a bearish trend on the D1 chart. Multi-timeframe analysis is standard practice among professional traders: first identify the trend on the higher timeframe, then look for an entry point on the lower one. If the daily trend is bearish, bullish patterns on the hourly chart get traded cautiously, or not at all.
Candlestick Pattern Effectiveness Statistics for Traders
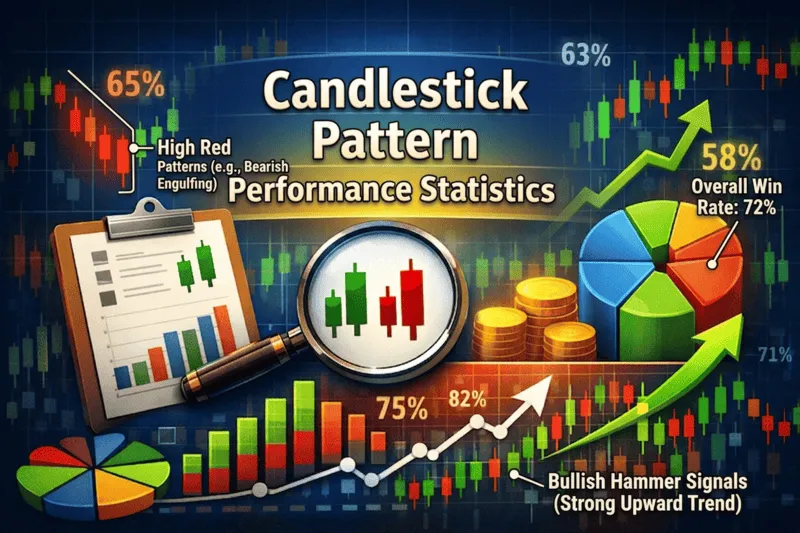
Candlestick analysis remains one of the most extensively studied areas of technical analysis. Research conducted on historical financial-market data yields concrete effectiveness figures.
Overall Usage Statistics
According to trader surveys, roughly 72% of professional market participants use candlestick patterns as one tool within their trading system. That said, only 18% trade purely off patterns with no additional filters — most combine candlestick analysis with levels, volume, and oscillators. Research on 20 years of S&P 500 data shows: the “Bullish Engulfing” pattern, traded strictly by the rules, delivers a profitable outcome in 68% of cases on the daily chart.
Effectiveness in the Crypto Market
The crypto market in 2025-2026 shows elevated volatility compared to traditional assets. This produces more patterns with long wicks — especially Hammer and Inverted Hammer — but also increases the share of false signals. On Bitcoin (BTC) and Ethereum (ETH), the average accuracy of candlestick patterns on the daily timeframe runs 62-68%, comparable to the stock market. On low-liquidity altcoins, accuracy drops to 45-55% due to price manipulation.
The Impact of Volume on Signal Reliability
The statistics are unambiguous: candlestick patterns formed on above-average volume (150% or more of the 20-day average) show accuracy 12-15% higher than the same patterns on average or low volume. The explanation is simple: high volume means large participants are behind the move, not random noise. The “Three White Soldiers” pattern shows 62% accuracy at normal volume, but 74-76% at elevated volume.
Comparison with Other Analysis Tools
In comparative studies, candlestick analysis lags combined systems in accuracy, but outperforms most standalone indicators. RSI in overbought/oversold territory delivers roughly 55-58% accuracy. Fibonacci levels run around 60-65%. Candlestick patterns at support and resistance levels run 65-72%. A combination of a candlestick pattern + a level + volume confirmation runs 74-80%.
Candlestick Analysis: Current Trends and Changes
Market Algorithmization and Patterns
As algorithmic trading’s share has grown (by various estimates, 60% to 80% of volume on leading exchanges), candlestick patterns have started behaving differently. Algorithms “see” classic patterns and either accelerate how they play out, or deliberately create false signals to capture liquidity. That means simple patterns like the Hammer increasingly need additional filters, and trading “textbook” setups with no adaptation to the modern market delivers diminishing results.
AI Integration in Pattern Recognition
In 2025-2026, tools hit the market that automatically recognize candlestick patterns in real time and assess their probability accounting for context. TradingView, Coinigy, and a number of broker terminals have integrated these modules. This has cut down on the labor of monitoring charts, but hasn’t eliminated the need to understand pattern logic: an AI scanner doesn’t replace a trading decision — it just flags that a signal is present.
Growing Popularity of Multi-Timeframe Analysis
Among professional traders, the practice of confirming patterns across several timeframes at once has become entrenched. If a “Bullish Engulfing” forms on the H4 but price sits in a resistance zone on the D1, the signal gets ignored. This approach filters out up to 30-40% of false entries. By 2026, most trading education courses include multi-timeframe analysis as a standard tool.
Candlestick Analysis in Crypto After the Bitcoin Halving
After Bitcoin’s halving in April 2024, the market entered a new cycle. In 2025-2026, classic reversal patterns on higher timeframes (W1, D1) showed elevated effectiveness on major cryptocurrencies, consistent with historical data from post-halving bull cycles. Traders working BTC and ETH on daily charts noted high accuracy for three-candle patterns like the Morning Star when they formed at key support levels.
Conclusion: Using Candlestick Patterns Effectively
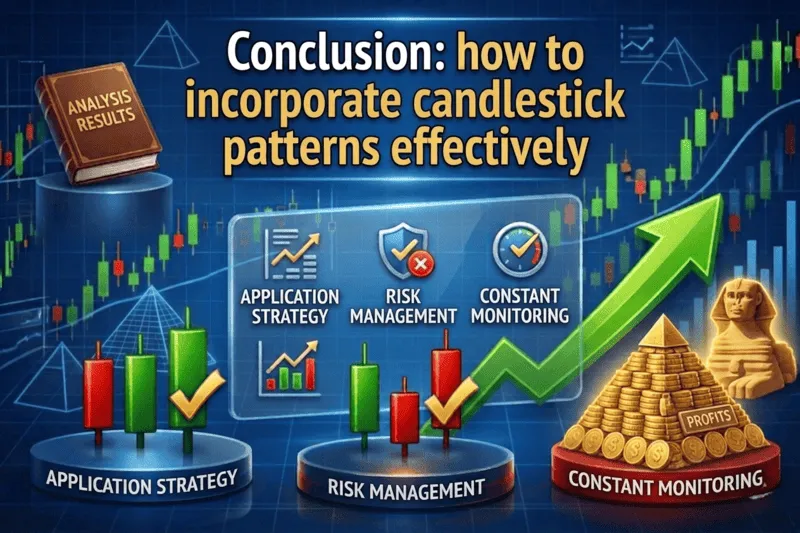
Candlestick analysis isn’t a trading system in itself — it’s the language the market speaks to a trader in. Once you learn that language, you can read most participants’ intentions before a price move becomes obvious. The main takeaways from this article: a pattern’s reliability depends directly on context — levels, volume, timeframe; even the best patterns need confirmation and strict risk management; trading with no stop-loss kills even the most profitable system; and adapting to the modern algorithmic market is a necessity, not an option.
For beginners: start with three to five patterns, drill them until they’re automatic on a demo account, then move to real trading with a minimal position size. Don’t increase your risk until your trading journal’s statistics show a stable, positive result across 50+ trades.
For experienced traders: combine candlestick analysis with volume levels, Market Profile, or Smart Money tools — this substantially improves the quality of your entry points. Treat patterns as one of several filters, not as the sole criterion for opening a position.
Keep up with new material and market breakdowns on PropTradingRank.com — current candlestick-pattern breakdowns on real crypto and Forex charts are published there regularly.
Frequently Asked Questions
Which candlestick pattern is best for beginners?
Start with "Bullish and Bearish Engulfing" — they're easy to identify visually, give clear stop-loss levels, and follow intuitive logic. Hammer and Inverted Hammer are the next step. These four patterns are enough for your first 50-100 real trades.
Do candlestick patterns work in the crypto market?
Yes, but with caveats. The crypto market is highly volatile and less liquid than Forex or stocks. That increases the number of false signals. On BTC and ETH, patterns work fairly consistently on D1 and H4. On smaller altcoins, reliability drops noticeably due to manipulation and low trading volume.
Can you trade using only candlestick patterns?
Theoretically, yes, but in practice it's not the best idea. Patterns with no context (levels, volume, trend) produce too many false signals. Most successful traders use candlestick analysis as one element of a trading system, not as the sole decision-making tool.
Which timeframe do patterns work best on?
The higher the timeframe, the more reliable the pattern, since each candle reflects a larger volume of data and trades. The daily (D1) and 4-hour (H4) are considered optimal for most traders. Minute and hourly timeframes are used to refine an entry point, not as the primary signal.
How do you tell a genuine pattern from a false one?
A few signs of a false pattern: it forms in the middle of a range rather than at the end of a trend; volume is below average; there's no confirmation from the next candle; the pattern contradicts the trend direction on the higher timeframe. If at least two of these conditions apply, it's better to skip the trade.
What is a doji, and how do you trade it?
A doji is a candle where the open and close prices are nearly identical. The body is minimal or absent, and the wicks can vary in length. A doji signals a balance of power between buyers and sellers — market indecision. A doji by itself isn't a trading signal — you need to look at the context: a doji after an extended uptrend suggests a possible downward reversal.
Should you factor in volume when analyzing patterns?
Yes, and it's critically important. A pattern formed on high volume (150% or more of the average) is 12-15% more accurate than the same pattern on average volume. Volume shows how serious market participants' intentions really are. Bullish Engulfing on low volume is a weak signal. The same pattern at double the normal volume is a very strong one.
How long does it take to learn to trade off patterns?
With regular practice, the basic patterns get absorbed within 2-4 weeks. Another 2-3 months goes into learning to correctly apply them with context in mind. Professional-level skill takes six months to a year of real trading with a journal. Don't rush into real money — first drill your system on a demo account until you have positive statistics.
Related Articles:










- How Japanese Candlesticks Work: The Mechanics of Candlestick Analysis
- The Most Profitable Candlestick Patterns: A Breakdown by Group
- How to Read Candlestick Patterns: A Step-by-Step Guide for Traders
- Comparing Candlestick Patterns: Reliability and Application
- Risks and Mistakes When Using Candlestick Analysis
- Candlestick Pattern Effectiveness Statistics for Traders
- Candlestick Analysis: Current Trends and Changes
- Conclusion: Using Candlestick Patterns Effectively

Top 10 Best Prop Firms
| # | Prop Firm | Rating | Assets | Profit Split | Funded Capital | Challenge Fee | Founded | Promo Code | Website |
|---|---|---|---|---|---|---|---|---|---|
|
1
|
4.9
|
Crypto, Stocks, Indices, Metals, Energy
|
Up to 90% | Up to $200,000 | From $79 | 2023 |
20% discount
RANK20
|
Visit Website | |
|
2
|
4.8
|
Crypto, Forex
|
Up to 90% | Up to $200,000 | From $99 | 2023 |
20% discount
RANK20
|
Visit Website | |
|
3
|
4.7
|
Prediction Markets, Polymarket
|
Up to 90% | Up to $50,000 | From $30 | 2026 |
25% discount
RANK25
|
Visit Website | |
|
4
|
4.7
|
Crypto, Forex, Other Assets
|
Up to 90% | Up to $200,000 | From $59 | 2024 |
10% discount
Follow the link
|
Visit Website | |
|
5
|
4.7
|
Crypto
|
Up to 90% | Up to $200,000 | From $59 | 2023 |
10% discount
Follow the link
|
Visit Website | |
|
6
|
4.6
|
Crypto, Forex, Stocks, Indices, Metals, Energy
|
80%–100% | Up to $200,000 | From $49 | 2026 |
30% discount
RANK30
|
Visit Website | |
|
7
|
4.6
|
Forex, Stocks, Indices, Metals
|
Up to 90% | Up to €300,000 | From €40 | 2023 |
30% discount
RANK30
|
Visit Website | |
|
8
|
4.5
|
Crypto, Forex, Indices, Metals
|
80%–100% | Up to $200,000 | From $89 | 2013 |
No Promo Code
|
Visit Website | |
|
9
|
4.5
|
Crypto, Forex
|
Up to 90% | Up to $200,000 | From €79 | 2015 |
No Promo Code
|
Visit Website | |
|
10
|
4.3
|
Crypto, Forex, Other Assets
|
60%–95% | Up to $200,000 | From $32 | 2024 |
20% discount
HELLO
|
Visit Website |