



The Trading Journal: Why You Need One and How to Keep It Right

A trading journal is the tool that separates trading from gambling. Without logging trades, a trader works blind: they don’t know which entry points make money, what time of day trades tend to lose, or which psychological states lead to breaking their own strategy. Keeping a trading journal means turning chaotic trading experience into a structured database you can draw conclusions from and use to improve your results.
This article breaks down: exactly what to log in a trade journal, and why most traders do it wrong; which journal formats suit different experience levels — from Google Sheets and Excel tables to specialized services; how to analyze your entries to find your trading system’s strengths and weaknesses; and the mistakes that turn a journal from a useful tool into a formality abandoned after two weeks. If you want to trade the financial markets consistently, start here.

- How a Trading Journal Works: The Mechanics and Principles
- Trading Journal Formats: From Spreadsheets to Specialized Platforms
- How to Start a Trading Journal: A Step-by-Step Guide
- Tools for Keeping a Trading Journal: A Comparative Analysis
- Common Journal-Keeping Mistakes and How to Avoid Them
- What the Statistics Say: Data on How a Journal Affects Trading Results
- Trends: How Trading-Journal Practices Are Changing
- Conclusion: The Journal as the Foundation of Professional Growth
How a Trading Journal Works: The Mechanics and Principles
A trading journal rests on a simple idea: every trade is an experiment, and the trade log is the record of that experiment. Without a record, you can’t reproduce a successful result, and you can’t understand what went wrong on a losing trade. That’s exactly why keeping a journal is standard practice among professional traders and a mandatory condition at most prop trading firms that fund traders on their accounts.
The mechanism works through accumulating statistics. One trade tells you nothing about the quality of a trading strategy — the result could be random. Twenty trades give you an initial picture. A hundred trades reveal the real math: your win rate, your average risk/reward ratio, and how results depend on time of day or the instrument chosen. Meaningful decisions about adjusting a trading system get built off exactly this kind of data.
Here’s an analogy: picture an athlete training with no record of their results. They run every day, but don’t time themselves, don’t track progress, and don’t know which exercises actually work. After a year of training, they might be right back where they started. A trader with no journal is in the same spot: trading for months with no understanding of whether their system is growing or stagnating.
What a proper trading journal logs: the date and time a position opened; the trading instrument (currency pair, stock, crypto, futures); trade direction (buy or sell); entry and exit price; position size and stop-loss level; take-profit level; the reason for entry (a pattern, an indicator signal, a support/resistance level); the final financial result in dollar terms and as a percentage of the deposit; your emotional state at the moment of entry and exit; and a comment on what went according to plan and what didn’t.
That last item — emotional state — might seem unnecessary, but it’s exactly what reveals hidden patterns. If 80% of losing trades were opened in a state of “trying to win back a loss” or “the market looks obvious,” that’s critically important information. Market analysis with no accounting for the psychological factor gives you an incomplete picture.
How often to log: entries go in immediately after each trade closes, while the details are fresh. Putting it off “for later” means losing accuracy: a few hours later, a trader won’t remember the exact reason for entry or their mindset at the moment of the decision. Discipline in keeping a journal matters just as much as discipline in the trading itself.
Trading Journal Formats: From Spreadsheets to Specialized Platforms
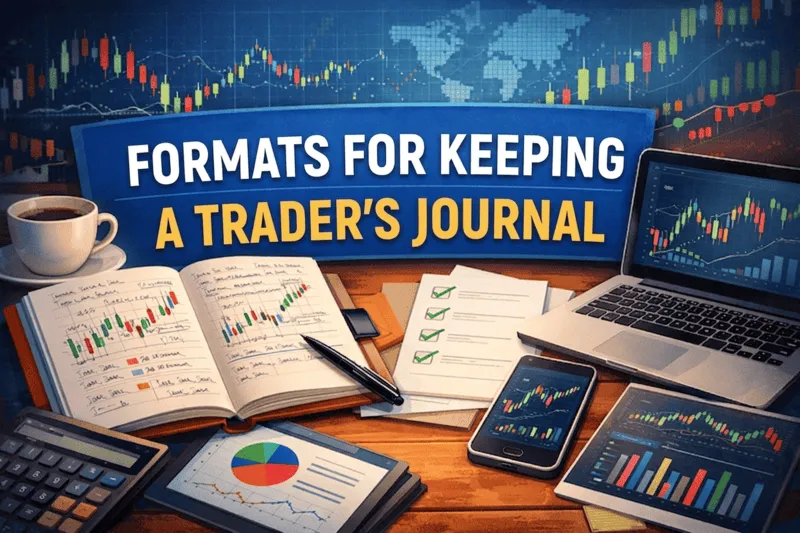
A Trading Journal in Excel or Google Sheets
The most accessible format: a spreadsheet in Excel or Google Sheets. A trader creates columns for each trade parameter and fills in rows manually. The upside: complete flexibility to customize it around your own trading system, free, and no sign-up required. The downside: it takes time to build the template and requires manual data entry after every trade. This suits beginner traders and anyone making up to 10-15 trades a day.
Specialized Trading Journals (Edgewonk, TraderSync, Tradervue)
Specialized services let you import trade history directly from your trading terminal, automatically build return charts, and give detailed statistics for every parameter. Edgewonk analyzes psychological patterns and shows which days of the week and market conditions you trade best in. TraderSync integrates with most brokers and trading platforms. These tools cost $30 to $80 a month, but they pay for themselves through the depth of the analytics.
A Journal in Notes with Attached Screenshots
The simplest option for anyone just starting out: a folder in Notion, Obsidian, or your phone’s regular notes app, where each entry gets a chart screenshot attached at the moment of entry. This method works well because visual context — a real chart with your levels marked — says more than numbers in a table. After three months, a trader will spot patterns they didn’t notice in the moment. The downside: it’s inconvenient for analyzing statistics across a large number of trades.
Built-in Trading Platform Tools
Some trading platforms (cTrader, NinjaTrader, thinkorswim from TD Ameritrade) have built-in trade history with basic analytics. You can export this data to Excel for deeper analysis. The downside: built-in tools usually don’t let you add subjective comments about entry reasons and emotional state — just numeric data.
A Paper Journal with Handwritten Entries
Some traders deliberately choose the paper format: writing by hand slows the process down and forces you to think through every word. Psychological research shows handwritten notes stick in memory better. The optimal approach: combine a digital spreadsheet for statistics with a paper journal for reflection and reviewing the trading day.
How to Start a Trading Journal: A Step-by-Step Guide
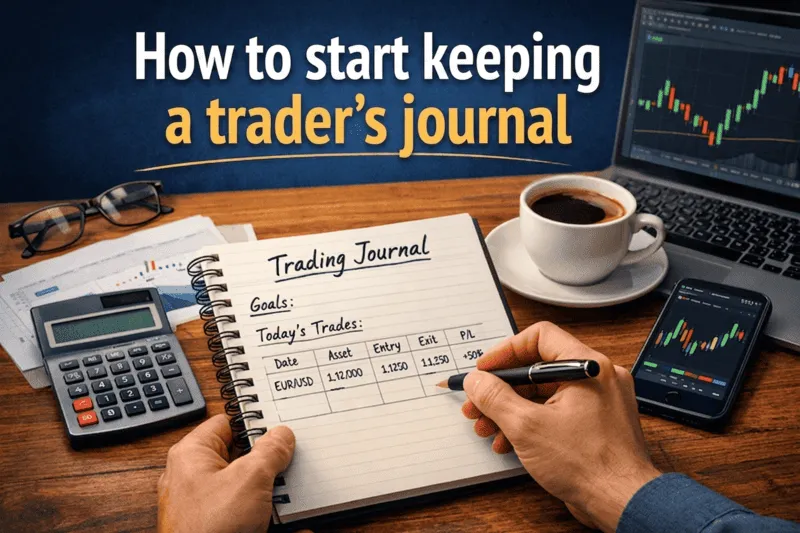
Step 1. Choose a format that fits your level and trading volume.
If you’re just starting out and making 3-5 trades a week, a Google Sheets template is enough. For active intraday trading with dozens of trades a day, it’s smarter to set up a specialized service with auto-import from your trading platform right away. A mistake: starting with an overly complex tool, spending hours setting it up, and abandoning it after three days.
Step 2. Define the minimum set of fields you’ll always fill in.
Start with 7-8 mandatory fields: date and time, instrument, direction, entry price, stop-loss, exit price, and result in USD/%. Add “reason for entry” and “emotional state” right away — you’ll need them for genuine analysis. A mistake: including 20 fields from day one. Within a week, filling it out will take 15 minutes per trade, and the motivation to keep a journal will vanish.
Step 3. Log the trade immediately after it closes — don’t put it off.
Open the journal tab before closing the position. The moment the trade closes, enter the data. Attach a chart screenshot with your entry, stop-loss, and take-profit levels marked. A mistake: “I’ll remember and write it down tonight.” By evening, only the numbers will be left — the context and emotions will be gone.
Step 4. Do a weekly review.
Once a week, ideally on a day off, review every trade from the past days. Answer three questions: which trade was the best, and why; which was the worst, and what caused the mistake; what repeated several times (a pattern in behavior or in market conditions). A mistake: logging entries but never analyzing them. A journal with no analysis is just an archive of numbers.
Step 5. Do a deep monthly statistics review.
Once a month, look at your aggregated data: your win rate for the period, average risk/reward ratio, results by day of the week and time of day, and results by individual instrument. This data will show you where your trading system works and where it doesn’t. A mistake: not breaking down statistics by entry type or market condition. An overall win-rate figure masks important details.
Step 6. Adjust your trading rules based on the data.
A trade journal isn’t for record-keeping — it’s for making changes. If your statistics show 70% of losses happen on trades opened in the first hour after the European session opens, that’s a concrete conclusion pointing to a concrete rule. A mistake: spotting a pattern in the data but not changing your behavior, hoping “next time will be different.”
Step 7. Keep an archive, and don’t delete losing periods.
Losing streaks contain the most valuable information about your trading system’s weak spots. Traders who delete “bad” entries or simply don’t log losing trades deprive themselves of the chance to learn from mistakes. Back up your journal every 3-6 months and keep the full history of your trading.
Tools for Keeping a Trading Journal: A Comparative Analysis
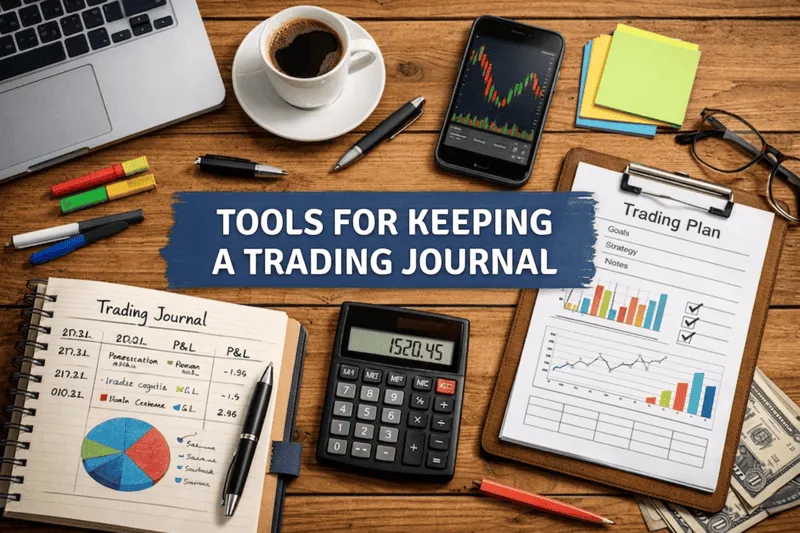
The market for trading-journal tools has grown diverse: from free spreadsheets to full analytics platforms with AI analysis. Your choice depends on trading style, how many trades you make a day, and your willingness to pay for automation. Here’s a comparison of the main options.
| Tool | Price | Trade Auto-Import | Statistics & Analytics | Psych Analysis | Best For |
|---|---|---|---|---|---|
| Google Sheets / Excel | Free | No (manual entry) | Manual (formulas) | No | Beginners |
| Edgewonk 3.0 | From $169/yr | Yes (CSV, API) | Detailed, automatic | Yes (ThinkingEdge) | Experienced, serious analysis |
| TraderSync | From $29.95/mo | Yes (40+ brokers) | High level | Partial | Active traders |
| Tradervue | Free / $49/mo | Yes (major brokers) | Medium level | No | Stocks, day trading |
| Notion + screenshots | Free / $10/mo | No | Visual only | Manual notes | Swing traders, beginners |
Google Sheets is the optimal starting point: zero cost, complete flexibility, and ready-made trading-journal templates in Excel format are easy to find publicly. Edgewonk stands out for its psychological-analysis module: it tracks how emotional notes in your entries correlate with financial results — something unavailable in other tools. TraderSync suits active traders working through brokers with API-import support: manual entry simply takes too much time.
The takeaway: no tool makes trading profitable by itself — analytical discipline does. Start with a free format, build the habit of keeping a journal, and only then move to paid services.
Common Journal-Keeping Mistakes and How to Avoid Them
Inconsistent Logging
The most common problem: a trader fills in the journal for the first two weeks, then takes “a couple of days” off, and abandons it. Gaps in trade history make statistics unreliable and devalue all the previous effort. How to avoid it: tie journal-keeping to your trading routine — don’t close the trading platform until the entry is logged.
Only Logging Profitable Trades
Some traders psychologically avoid recording losing trades — “why remember the bad stuff.” This is a fatal mistake: losing trades are exactly what contains information about your trading system’s weak spots. A trade journal missing its losses shows a distorted picture and doesn’t let you build real statistics.
Entries That Are Too Detailed or Too Sparse
Both extremes are equally harmful. An entry like “bought Bitcoin, came out ahead” carries zero analytical value. But a page-long essay after every trade isn’t sustainable long-term. The optimal entry length is 3-5 minutes per trade for manual logging. It’s enough to note the reason for entry in two sentences and one key takeaway from the outcome.
Analysis with No Conclusions or Changes
Some traders keep a diligent journal and even review it regularly, but never draw concrete conclusions or change their trading rules. A journal isn’t the goal in itself. Real value shows up the moment data leads to a concrete decision: “starting Monday, I won’t trade the first 30 minutes after session open,” or “I’m removing low-liquidity pairs from my trading.”
Ignoring Psychological Notes
Number-oriented traders often skip the “emotional state” column, considering it subjective and unnecessary. But that exact parameter reveals patterns invisible through numeric analysis alone — for example, that a trader consistently loses money on trades opened “out of boredom” or “so as not to miss a move.” Without this information, the problem stays invisible.
What the Statistics Say: Data on How a Journal Affects Trading Results

The Share of Traders Who Keep a Trade Journal
According to community surveys from TraderSync and Edgewonk for 2024-2025, roughly 22-27% of active retail traders systematically keep a trade journal. Among traders working at prop firms, that figure is higher — around 65-70%, since journal-keeping is often a mandatory funding condition. The gap is telling: most people trade with no structured record of their own actions.
The Impact of a Journal on Long-Term Results
Internal research from several prop firms (FTMO, MyForexFunds, data from 2023-2024) found: traders who kept a detailed journal and did weekly reviews showed 34-41% less drawdown over a 6-month period compared to a group trading with no journal. The share of profitable traders in the first group was 2.3 times higher.
The Psychological Effect of Recording Decisions
Research in behavioral finance (Barber & Odean, extended work from 2020-2024) confirms: writing down the reason for entry before opening a trade reduces impulsive decisions by 28-35%. A trader required to articulate their reason for entry in writing enters trades “on a feeling” less often — simply because it takes effort.
Time Cost and Its Payoff
The average time to log one trade with a properly set-up template is 3-7 minutes. At 10 trades a day, that’s 30-70 minutes. Experienced traders with auto-import from their terminal cut that down to 10-15 minutes for a daily review. Traders who regularly analyze their journal cut their number of losing trades by an average of 15-25% within the first three months of keeping one.
Trends: How Trading-Journal Practices Are Changing

AI Analysis of Trading Patterns
Leading trading-journal platforms started integrating AI assistants that analyze trade history and deliver personalized recommendations. Edgewonk and TraderSync rolled out features where an algorithm independently identifies weak spots in the statistics — for example, flagging that a trader loses money on Friday evenings or when trading news events. This moves journal analysis from a manual level to automatic diagnostics.
API Integration with Crypto Exchanges
Growing crypto trading volumes have led leading trade journals to add direct integration with Binance, Bybit, OKX, and other major exchanges via API. A trader connects their exchange account once, and every subsequent trade imports automatically. This solves the problem of inconsistent logging and makes keeping a journal practically effortless in terms of time.
The Growth of Prop Trading Culture and Mandatory Journals
Prop trading firms that fund traders (FTMO, The Funded Trader, Topstep) tightened their journal-keeping requirements through 2025-2026. Some firms introduced mandatory trading-journal report submissions as a condition for extending funding. This has established a new norm: a trader seeking outside funding must document their decisions.
Mobile Apps for Trading Journals
Several services released full-featured mobile apps for iOS and Android, letting traders log entries and attach screenshots from their phone right after closing a position. This matters especially for traders who trade from mobile devices: previously, transferring data to a computer got delayed and lost. A mobile journal lowers the discipline barrier and increases how consistently entries get logged.
Conclusion: The Journal as the Foundation of Professional Growth

A trading journal isn’t bureaucratic formality — it’s a working growth tool. A trader who logs their trades, analyzes mistakes, and draws conclusions develops many times faster than someone trading for years “on experience” alone. Data doesn’t lie: it shows the real picture, with no self-justification and no illusions about success.
For beginners: start with a simple Google Sheets template today, log your first 20-30 trades, and run your first analysis. For traders with up to a year of experience: if you already keep a journal, audit it — how thoroughly are you logging entry reasons and psychological state? For experienced, active traders: consider moving to a specialized service with auto-import and AI analytics — manual entry becomes a bottleneck at high trade volumes.
Keep up with new breakdowns of trading tools, strategies, and practical guides on PropTradingRank.com — material gets published regularly and is oriented toward real practice, not theory.
Frequently Asked Questions
Do you need to keep a trading journal if you only trade crypto?
Yes, and especially in crypto. The crypto market is defined by high volatility and round-the-clock trading, which triggers impulsive decisions. A trade journal helps identify which time of day and which market conditions your decisions turn into losses. Without one, recurring mistakes stay unnoticed.
What's the minimum set of data you need to log for each trade?
The minimum: date and time, instrument, direction, entry price, stop-loss, exit price, and result in USD. That's the base set for statistics. Add the reason for entry and a brief summary, and you have a journal you can already draw conclusions from.
Can you use a free trading-journal template in Excel?
Yes. Ready-made trading-journal templates for Excel and Google Sheets are easy to find through a search — many are shared for free. Pick one that has the fields you need and adapt it to your trading strategy. Don't spend too much time hunting for the "perfect" template — start with any one and refine it as you go.
How often should you analyze your trade journal?
The optimal cadence: a quick review every day after the trading session (5-10 minutes), a weekly analysis once a week (30-60 minutes), and a deep statistics review once a month. The daily review gives you real-time feedback; the monthly one gives you strategic insight into whether your trading system actually works.
Is it worth paying for a specialized service, or is a spreadsheet enough?
A spreadsheet is enough for most traders making up to 20-30 trades a week. A paid service justifies itself with active trading (50+ trades a week) or when you feel you can't keep up with the analysis manually. If you're planning to work with a prop firm, some require specific reporting formats, so check the requirements ahead of time.
What should you do if you haven't kept a journal for a few weeks and lost your history?
Your trade history is stored on your trading platform or exchange — export it through the trade-history export feature (CSV or Excel). Most brokers keep history for at least 12 months. Reconstruct the data retroactively, but skip the subjective comments — those can't be recovered. Starting today, begin again with full entries.
Should you log trades on a demo account?
Yes, and it's especially useful for beginners. A demo-account journal lets you build the habit of logging entries with no financial pressure. Comparing demo and real-account statistics often reveals an interesting pattern: real-account results are worse due to the emotional factor. That exact gap is valuable information for working on your trading psychology.
How does a trading journal connect to risk management?
A journal and risk management work together: the journal logs the facts, and risk management uses that data to make decisions about position size and stop-loss levels. For example, if your journal shows the average loss on a trade that deviated from plan is twice the planned amount, that's a signal to tighten your risk-management rules.
Related Articles:















- How a Trading Journal Works: The Mechanics and Principles
- Trading Journal Formats: From Spreadsheets to Specialized Platforms
- How to Start a Trading Journal: A Step-by-Step Guide
- Tools for Keeping a Trading Journal: A Comparative Analysis
- Common Journal-Keeping Mistakes and How to Avoid Them
- What the Statistics Say: Data on How a Journal Affects Trading Results
- Trends: How Trading-Journal Practices Are Changing
- Conclusion: The Journal as the Foundation of Professional Growth

Top 10 Best Prop Firms
| # | Prop Firm | Rating | Assets | Profit Split | Funded Capital | Challenge Fee | Founded | Promo Code | Website |
|---|---|---|---|---|---|---|---|---|---|
|
1
|
4.9
|
Crypto, Stocks, Indices, Metals, Energy
|
Up to 90% | Up to $200,000 | From $79 | 2023 |
20% discount
RANK20
|
Visit Website | |
|
2
|
4.8
|
Crypto, Forex
|
Up to 90% | Up to $200,000 | From $99 | 2023 |
20% discount
RANK20
|
Visit Website | |
|
3
|
4.7
|
Prediction Markets, Polymarket
|
Up to 90% | Up to $50,000 | From $30 | 2026 |
25% discount
RANK25
|
Visit Website | |
|
4
|
4.7
|
Crypto, Forex, Other Assets
|
Up to 90% | Up to $200,000 | From $59 | 2024 |
10% discount
Follow the link
|
Visit Website | |
|
5
|
4.7
|
Crypto
|
Up to 90% | Up to $200,000 | From $59 | 2023 |
10% discount
Follow the link
|
Visit Website | |
|
6
|
4.6
|
Crypto, Forex, Stocks, Indices, Metals, Energy
|
80%–100% | Up to $200,000 | From $49 | 2026 |
30% discount
RANK30
|
Visit Website | |
|
7
|
4.6
|
Forex, Stocks, Indices, Metals
|
Up to 90% | Up to €300,000 | From €40 | 2023 |
30% discount
RANK30
|
Visit Website | |
|
8
|
4.5
|
Crypto, Forex, Indices, Metals
|
80%–100% | Up to $200,000 | From $89 | 2013 |
No Promo Code
|
Visit Website | |
|
9
|
4.5
|
Crypto, Forex
|
Up to 90% | Up to $200,000 | From €79 | 2015 |
No Promo Code
|
Visit Website | |
|
10
|
4.3
|
Crypto, Forex, Other Assets
|
60%–95% | Up to $200,000 | From $32 | 2024 |
20% discount
HELLO
|
Visit Website |