



Price Action in Trading: How to Read the Market with No Indicators

Thousands of traders blow their deposits every year chasing the “perfect” indicator that’ll tell them where price is headed next. Meanwhile, experienced market participants have long known the best analysis tool is the chart itself. Price action in trading is a method where decisions get made purely off price movement, with no MACD, RSI, moving averages, or other supporting tools. That’s exactly what makes it one of the most honest and versatile approaches to working the financial markets.
This article breaks down: what price action is, how the method works under the hood, which price action patterns professionals use, how to build a trading strategy off a clean chart — and why this approach is becoming even more relevant in 2026. You’ll get a practical guide suited both for a beginner just getting acquainted with trading and an experienced trader looking to simplify and systematize their trading system.
- What Price Action Is: The Mechanism Under the Hood
- Core Price Action Patterns: From Basic to Advanced
- How to Start Trading Price Action: A Step-by-Step Guide
- Price Action vs. Indicator-Based Trading: Comparing Approaches
- The Risks and Limitations of Price Action: What Training Courses Don’t Tell You
- Statistics and Data: Who Uses Price Action and How
- Current Price Action Trends
- Conclusion: Where to Start and What to Do Next
- Recommendations for Different Types of Readers
What Price Action Is: The Mechanism Under the Hood
Price action is a technical-analysis methodology where a trader reads the market off a clean chart with no indicators. The method rests on the idea that price already contains all available information: news, participant sentiment, institutional-investor expectations. Japanese candlesticks, bars, and lines are the entire toolkit. This isn’t a simplification — it’s a fundamentally different way of perceiving the market.
How does this work in practice? Every candle on a chart is four data points: the open, close, high, and low for that period. The candle’s body shows who won the battle between buyers and sellers. A long wick at the bottom tells you sellers pushed price down, but buyers took back control. A long wick at the top is the mirror image. A trader who understands these signals is literally reading market psychology in real time.
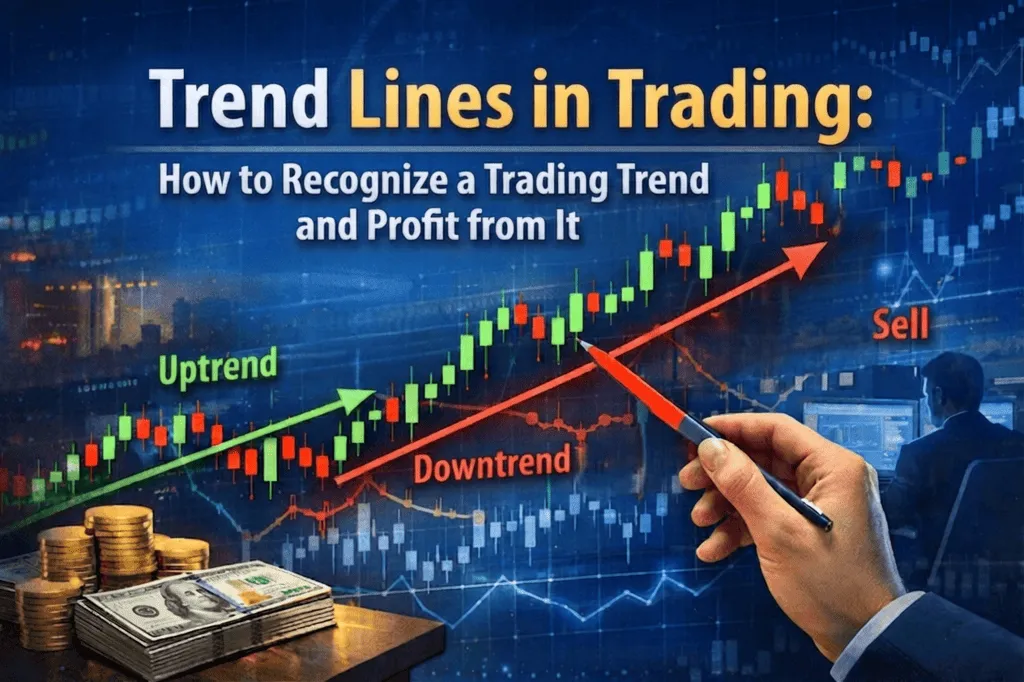
Market structure holds center stage. The market moves in waves: a sequence of higher highs and higher lows signals an uptrend; the reverse signals a downtrend. When price stops making new highs in an uptrend, that’s the first sign of a direction change. Professionals call this moment a “break of structure” (BOS), and it’s exactly where they look for entry points.
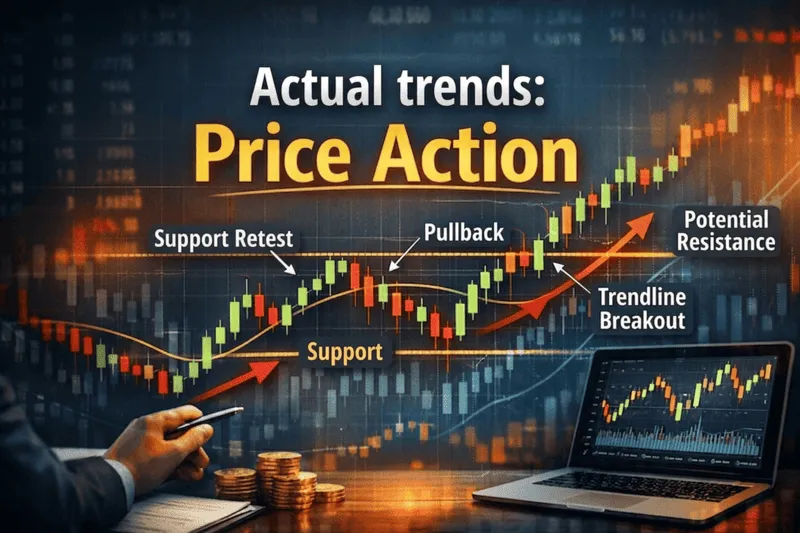
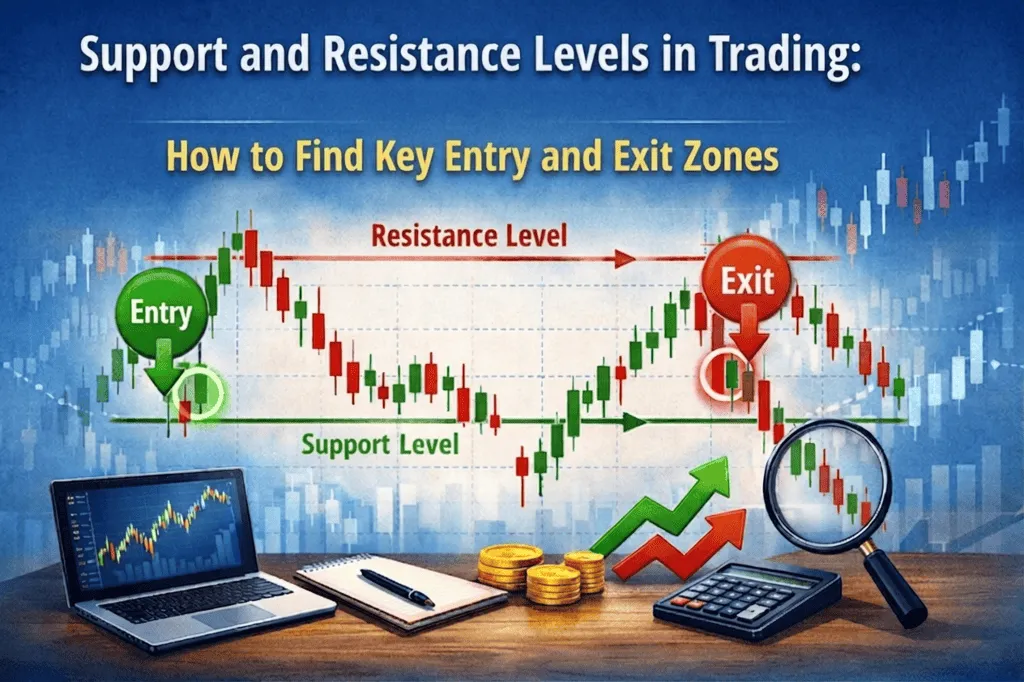
Support and resistance levels are another core element. A support level is a horizontal zone where demand has historically outweighed supply and price has reversed upward. A resistance level is the reverse situation. The more times price has tested a level and bounced off it, the more significant it’s considered. After a resistance level breaks, it often turns into support — this principle is called “polarity flip.”
Supply and demand zones work differently than simple horizontal lines. These are areas on the chart where price previously left with high speed. That sharp reaction means large interest sits there — a market maker or institutional player placed a big order. When price returns to that zone, there’s a good chance of a repeat reaction. Working with supply and demand zones is essentially trading in the footsteps of large participants.
The timeframe matters fundamentally: the same asset on the hourly and daily chart gives different signals. Professionals use the “top-down analysis” principle: first checking a higher timeframe (weekly, daily) to establish overall context and direction, then moving to a lower one (hourly, 15-minute) to find the precise entry point. This lets you trade in the direction of the stronger trend while avoiding false signals.
Core Price Action Patterns: From Basic to Advanced
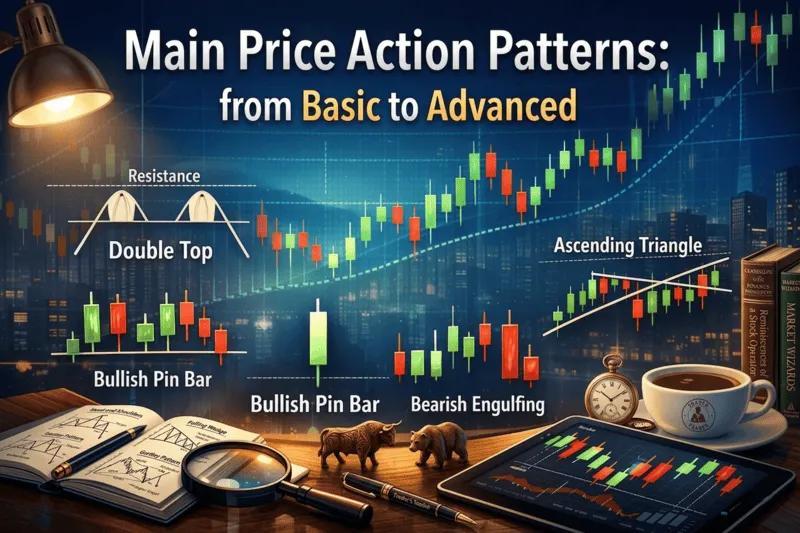
Price action patterns are recurring candle and price-movement configurations that have a high probability of preceding a specific market reaction. It’s important to understand: a pattern by itself isn’t a trading signal. It only works in the right context — at a significant level, in the direction of the higher-timeframe trend.
Pin Bar
One of the most well-known reversal patterns. A pin bar has a long wick (tail) on one side and a small body. A long wick pointing down at a support level signals a rejection of lower prices — buyers seized the initiative. The same signal at a resistance level, but with the wick pointing up, is a seller’s signal. The stop-loss goes beyond the tip of the wick, and the take-profit sits at the nearest significant level.
Engulfing
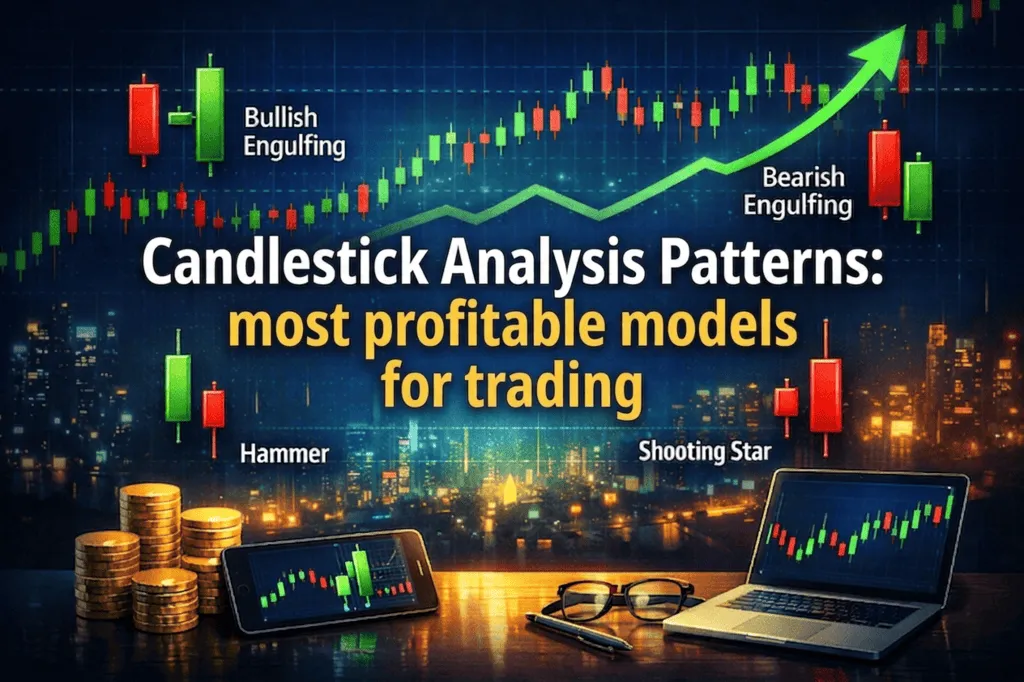
A bullish engulfing pattern happens when the second candle’s body fully “engulfs” the first candle’s body, and the second candle closes higher. A bearish engulfing pattern is the mirror image. Engulfing patterns are especially strong when they form after an extended move and at key levels. This pattern works better on higher timeframes, where each candle carries more weight.
Inside Bar
An inside bar sits entirely within the range of the previous candle. This signals consolidation and a squeeze in volatility ahead of the next move. A breakout of an inside bar in the direction of the trend is often the start of a new impulse. Traders place buy orders above the high or sell orders below the low of the mother bar, with a stop-loss beyond the opposite boundary.
Head and Shoulders
A classic reversal pattern made up of three peaks: the middle one (the head) is higher than the two outer ones (the shoulders). A neckline connects the lows between the peaks. A break of the neckline downward is a sell signal, with a target equal to the distance from the head to the neckline. An inverse head and shoulders works as a reversal signal for a downtrend. This is one of the most thoroughly studied and statistically confirmed patterns in technical analysis.
Flag and Pennant
Trend-continuation patterns. After a strong impulsive move (the flagpole), price consolidates within a narrow channel (a flag) or a triangle (a pennant). A breakout in the direction of the original move is an entry signal. The target level is the flagpole’s length, measured from the breakout point. These patterns let you enter an already-established trend with minimal risk.
How to Start Trading Price Action: A Step-by-Step Guide
Moving to trading on a clean chart demands a systematic approach. Below is a sequence of steps that helps you build a trading system from scratch while avoiding common beginner mistakes.
Step 1. Choose your asset and timeframe.
Start with one or two instruments: EUR/USD or BTC/USDT — liquid markets with predictable price behavior. The optimal timeframe for learning is the daily or 4-hour chart. Clearer levels and patterns form there than on minute charts. A common beginner mistake: hopping between dozens of instruments chasing the “best” signal.
Step 2. Mark your key levels.
Open the daily chart and mark the zones where price has reversed at least twice. That’s your key support and resistance. Don’t try to mark “every” level — pick the 3–5 most significant ones. Extra lines on a chart create an illusion of analysis without delivering real trading value.
Step 3. Identify market structure.
Look at the last 50–100 candles on the daily chart. Price making new highs and lows in one direction means a trend. Moving within a horizontal range means a range-bound market. Trading with the trend is statistically more profitable. Trying to catch a reversal “against everyone” is a frequent cause of blown deposits among beginners.
Step 4. Wait for a pattern at a level.
When price approaches a significant level, move to a lower timeframe (1–4 hours) and look for one of the known patterns: pin bar, engulfing, inside bar. The pattern needs to confirm a bounce or a breakout of the level. Entering the trade the moment you see any candle at the level is a mistake — you need to wait for confirmation via candle close.
Step 5. Calculate your risk/reward ratio.
Before entering, determine: where your stop-loss goes (beyond the pattern or the level), and where your take-profit goes (the next significant level). The recommended ratio is at least 1:2 (1% risk, 2% potential). Below a 1:1.5 ratio, most traders can’t turn a profit even with a 60% win rate. Risk management is the foundation of every working trading strategy.
Step 6. Log the trade in your journal.
After every trade closes, record: the instrument, timeframe, pattern, entry level, stop-loss, take-profit, and outcome. After 50–100 trades, you’ll see which patterns and conditions work best in your trading. A trading journal is the only way to turn subjective experience into statistics and objectively evaluate your trading system.
Step 7. Backtest against history.
Before trading real money, run a backtest: manually scroll through 6–12 months of history and mark where you’d have entered under your own rules. This lets you understand your real win rate with no risk to your deposit. Most platforms support manual backtesting. Skipping this step means learning on real money in a place where you could have learned for free.
Price Action vs. Indicator-Based Trading: Comparing Approaches
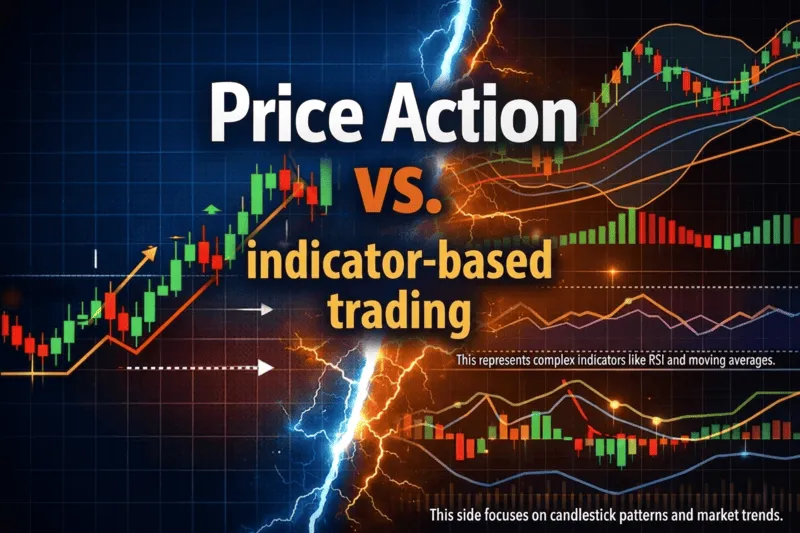
Price action isn’t the only approach to technical analysis. Let’s look at how it differs from other popular trading methods, and who each one suits best.
| Criterion | Price Action | Indicator Trading (RSI/MACD) | Algo Trading | Volume Analysis | Fundamental |
|---|---|---|---|---|---|
| Entry complexity | Medium | Low | High | Medium | High |
| Signal delay | None | Yes (lag) | None | Minimal | High |
| Applicable markets | Any market | Any market | Any market | Futures, stocks | Stocks, Forex |
| Requires chart-reading skill | Yes, deeply | Partially | No | Yes | No |
| Best suited for | Anyone wanting to understand the market | Beginners starting out | Programmers | Experienced traders | Investors |
Indicators aren’t inherently bad — they’re calculated off the same price data. The problem is they deliver a signal with a lag: by the time RSI crosses into overbought territory, the momentum has already run its course. Price action lets you see the signal earlier — the moment the candle itself is forming. That’s exactly why many experienced traders use indicators only as a supplementary filter, not as the basis for trading decisions.
Working with price action requires nothing more than a standard terminal: TradingView, MetaTrader 4/5, or any other platform that lets you draw horizontal lines and review history. No extra plugins or subscriptions needed. That makes the method accessible to traders with any budget — from a few hundred to millions of dollars.
The Risks and Limitations of Price Action: What Training Courses Don’t Tell You

Price action trading isn’t a “holy grail” or a guarantee of profit. The method has genuine limitations and risks worth understanding before you open your first trade on a real account.
Subjectivity of Interpretation
Two experienced traders can draw levels differently on the exact same chart and reach opposite conclusions. Price action has no rigid algorithm — it’s the art of reading the market, built through practice. Beginners tend to “see” patterns where none exist, or ignore context. The fix: keep a journal and rely on your own trade statistics, not intuition.
False Level Breakouts
One of the most painful scenarios: price breaks a resistance level, a trader enters a buy, and then price reverses and heads back down. These “stop hunts” get engineered by market makers to sweep up liquidity before a genuine move. The defense: don’t enter at the moment of the breakout — wait for a retest of the broken level with a confirming pattern.
Psychological Pressure
Price action requires sitting and waiting — often several days before a quality signal shows up. Most traders can’t handle it and enter out of boredom, breaking their own rules. Psychology is the biggest risk in trading, and it isn’t solved through better analysis. A trading plan, strict entry rules, and a fixed risk per trade are the only real tools against impulsive trading decisions.
Working in Range-Bound Markets
Price action works best in trending conditions. During an extended range, when price chaotically bounces between support and resistance, the number of false signals rises sharply. The professional solution: either reduce position size during a range, or move entirely to cash until a clear directional move appears.
The Risk of Overfitting to History
A backtest on historical data always looks better than live trading. Strategies showing 80% winning trades in the past often deliver only 40–50% in real time: the market changes, and patterns don’t repeat identically. Test your strategy on at least 2–3 years of history and across different market conditions — trending, range-bound, high volatility.
Statistics and Data: Who Uses Price Action and How
How Widespread the Method Is Among Professionals
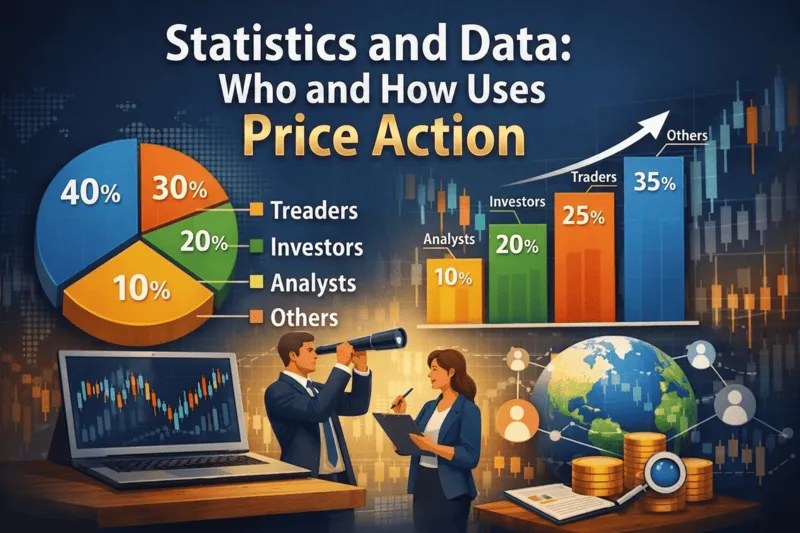
According to trading-behavior research, more than 60% of professional traders in Forex and crypto markets use price action elements as their primary or supplementary analysis tool. This figure has grown steadily since 2018, as the community has grown disillusioned with standard indicators, whose parameters are easy to optimize “to fit history” but hard to apply under real conditions.
Pattern Effectiveness
Academic research into stock and Forex markets shows: engulfing patterns at significant levels play out in 58–65% of cases on the daily timeframe. Pin bars at support and resistance levels play out in roughly 55–62% of cases. It’s important to understand: even a 55% win rate with a 1:2 risk/reward ratio delivers a durable mathematical edge. That’s exactly why risk management matters more than hunting for the “perfect” pattern.
The Crypto Market and Price Action
Trading volume in crypto markets topped $3 trillion a month across spot and derivatives in 2025–2026. Bitcoin, Ethereum, and altcoin volatility generates an elevated number of clear patterns that form faster than on traditional assets. At the same time, crypto’s high share of retail participants means more predictable behavior around psychological levels (round numbers: $100,000, $50,000, and so on).
Growing Interest in Learning
Search interest in “price action trading” grew significantly worldwide between 2021 and 2025. This reflects a broader trend: traders are looking for methods they can understand and apply on their own, with no expensive software or complex algorithms required. Access to information through YouTube, Telegram, and specialized resources has made learning to trade off a clean chart genuinely achievable for any beginner.
Current Price Action Trends
Smart Money Concepts (SMC)
The fastest-growing direction within price-action trading. SMC analyzes market structure through the lens of institutional participant activity: market makers, hedge funds, and large banks. Key concepts include the order block, the fair value gap, and the liquidity sweep. SMC has become the de facto standard among traders taking Forex and crypto trading seriously in 2025–2026.
Integrating Price Action with AI
Tools emerged that automatically recognize price action patterns on a chart in real time. TradingView and a number of other platforms offer AI assistants capable of highlighting levels, identifying patterns, and flagging zones of potential interest. That said, practicing traders note that automatic pattern recognition with no understanding of context still falls short of an experienced trader’s manual analysis.
Multi-Timeframe Analysis
Using at least three timeframes to make trading decisions has become standard. The higher timeframe provides context and trend. The middle timeframe identifies zones of interest and key levels. The lower timeframe gives the entry point with a minimal stop. This approach has sharply cut the number of false entries compared to single-timeframe trading and has become a baseline in most modern training programs.
Trading with Proprietary Firms (Prop Trading)
The prop trading market grew to several billion dollars in 2025–2026. Most prop firms — like FTMO, The Funded Trader, and similar companies — require traders to clear evaluation stages that directly test risk-management discipline and the quality of trading decisions. Price action remains the most in-demand strategy among funding candidates, since it’s easy to reproduce and explain to a company’s risk managers.
Conclusion: Where to Start and What to Do Next
Price action isn’t a set of magic patterns — it’s a way of thinking about the market. The method takes time to master, but it delivers something indicator-based systems lack: an understanding of why price moves, not just a record that it did. A trader who can read market structure, work with support and resistance, and recognize patterns in context gains a durable edge over anyone blindly following MACD or RSI signals.
Key takeaways: a clean chart delivers information with no lag; market structure and key levels are the foundation of any price action analysis; a pattern with no context isn’t a signal; risk management matters more than entry precision.
Recommendations for Different Types of Readers
Beginners
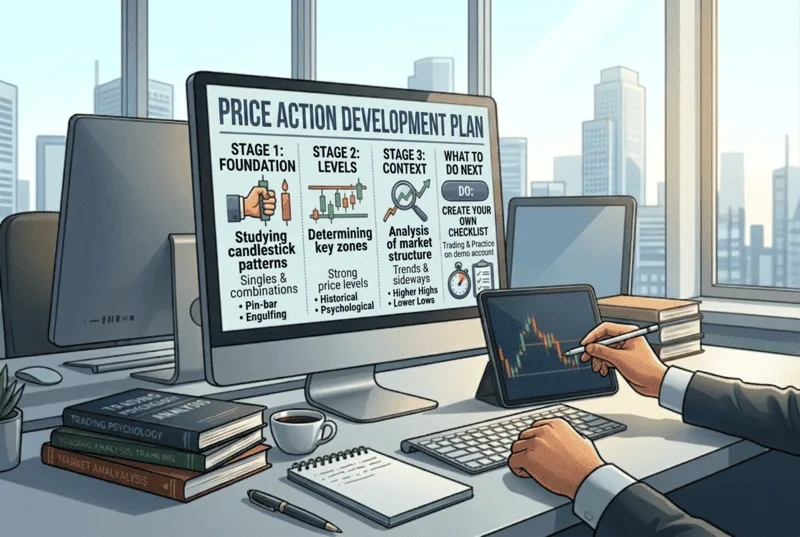
Start by studying Japanese candlesticks and market structure. Run 100 backtest trades on the daily BTC or EUR/USD chart before trading real money.
Experienced traders with an indicator-based system
Try removing every indicator for a month and trading purely off structure and levels. Compare the results against your usual strategy.
Traders preparing for a prop firm
Focus on mastering SMC concepts, practice trading strictly by risk-management rules (no more than 1–2% risk per trade), and log your results in a journal over the past 3 months.
Keep up with new articles on PropTradingRank.com — material on trading strategies, trading psychology, and practical market breakdowns gets published there regularly. Follow the project’s social media to get the latest updates first.
Frequently Asked Questions
What is price action, in plain English?
Price action is trading based on price movement with no indicators. A trader analyzes just the chart itself: candles, levels, and patterns. The principle rests on the idea that price already reflects all available market information, including news and the actions of large participants.
Does price action work for trading crypto?
Yes, and well. Crypto markets are among the most "readable" in terms of price behavior: high volatility creates pronounced patterns, and round psychological levels work especially cleanly. BTC and ETH on the 4-hour and daily timeframes are classic training instruments for learning the method.
Can you combine price action with indicators?
Yes. Many traders use indicators as a supplementary filter: a moving average, for example, to identify trend direction, and RSI to gauge overbought/oversold conditions. The key is not giving the indicator priority over analyzing market structure and key levels.
How long does it take to master price action?
The basic principles — candles, levels, patterns — can be learned in 1–2 months of active study. Building solid trading skills takes anywhere from 6 months to 2 years. The speed depends on how much time you spend practicing: backtesting, reviewing closed trades, keeping a journal.
Does price action work the same way on Forex as it does on stocks?
The principles work in any liquid market — Forex, stocks, futures, crypto, securities. The differences come down to details: on Forex, session levels matter (Asian, London, New York), while on stocks, the opening and closing levels of the trading session matter. But market structure, patterns, and the logic of supply and demand zones are universal.
What are Smart Money Concepts, and how do they differ from classic price action?
SMC is an extension of classic price action that adds analysis of institutional participants' "footprints." The classic approach focuses on patterns and levels. SMC adds concepts like the order block (the zone where a large participant entered the market), the fair value gap (imbalanced areas on the chart), and the liquidity sweep (a false breakout designed to sweep up stops). By 2026, SMC has become the standard among advanced traders.
Do you need a stop-loss when trading price action?
A stop-loss is mandatory on every trade — that's non-negotiable. Price action gives you logical places to put your stop: beyond a pin bar's wick, beyond a support or resistance level, beyond an order block. A fixed stop lets you calculate your risk in advance and stops a single losing trade from wiping out a string of wins.
How do you find good price action learning material?
For getting started, Al Brooks's books on price action trading and Lance Beggs's material are solid picks. Beyond that, specialized resources, Telegram channels breaking down real trades, and TradingView's public ideas section all publish quality analysis. Choose sources that show real statistics, not just their success stories.
Related Articles:











- What Price Action Is: The Mechanism Under the Hood
- Core Price Action Patterns: From Basic to Advanced
- How to Start Trading Price Action: A Step-by-Step Guide
- Price Action vs. Indicator-Based Trading: Comparing Approaches
- The Risks and Limitations of Price Action: What Training Courses Don’t Tell You
- Statistics and Data: Who Uses Price Action and How
- Current Price Action Trends
- Conclusion: Where to Start and What to Do Next
- Recommendations for Different Types of Readers

Top 10 Best Prop Firms
| # | Prop Firm | Rating | Assets | Profit Split | Funded Capital | Challenge Fee | Founded | Promo Code | Website |
|---|---|---|---|---|---|---|---|---|---|
|
1
|
4.9
|
Crypto, Stocks, Indices, Metals, Energy
|
Up to 90% | Up to $200,000 | From $79 | 2023 |
20% discount
RANK20
|
Visit Website | |
|
2
|
4.8
|
Crypto, Forex
|
Up to 90% | Up to $200,000 | From $99 | 2023 |
20% discount
RANK20
|
Visit Website | |
|
3
|
4.7
|
Prediction Markets, Polymarket
|
Up to 90% | Up to $50,000 | From $30 | 2026 |
25% discount
RANK25
|
Visit Website | |
|
4
|
4.7
|
Crypto, Forex, Other Assets
|
Up to 90% | Up to $200,000 | From $59 | 2024 |
10% discount
Follow the link
|
Visit Website | |
|
5
|
4.7
|
Crypto
|
Up to 90% | Up to $200,000 | From $59 | 2023 |
10% discount
Follow the link
|
Visit Website | |
|
6
|
4.6
|
Crypto, Forex, Stocks, Indices, Metals, Energy
|
80%–100% | Up to $200,000 | From $49 | 2026 |
30% discount
RANK30
|
Visit Website | |
|
7
|
4.6
|
Forex, Stocks, Indices, Metals
|
Up to 90% | Up to €300,000 | From €40 | 2023 |
30% discount
RANK30
|
Visit Website | |
|
8
|
4.5
|
Crypto, Forex, Indices, Metals
|
80%–100% | Up to $200,000 | From $89 | 2013 |
No Promo Code
|
Visit Website | |
|
9
|
4.5
|
Crypto, Forex
|
Up to 90% | Up to $200,000 | From €79 | 2015 |
No Promo Code
|
Visit Website | |
|
10
|
4.3
|
Crypto, Forex, Other Assets
|
60%–95% | Up to $200,000 | From $32 | 2024 |
20% discount
HELLO
|
Visit Website |