



Support and Resistance in Trading: How to Find Key Entry and Exit Zones

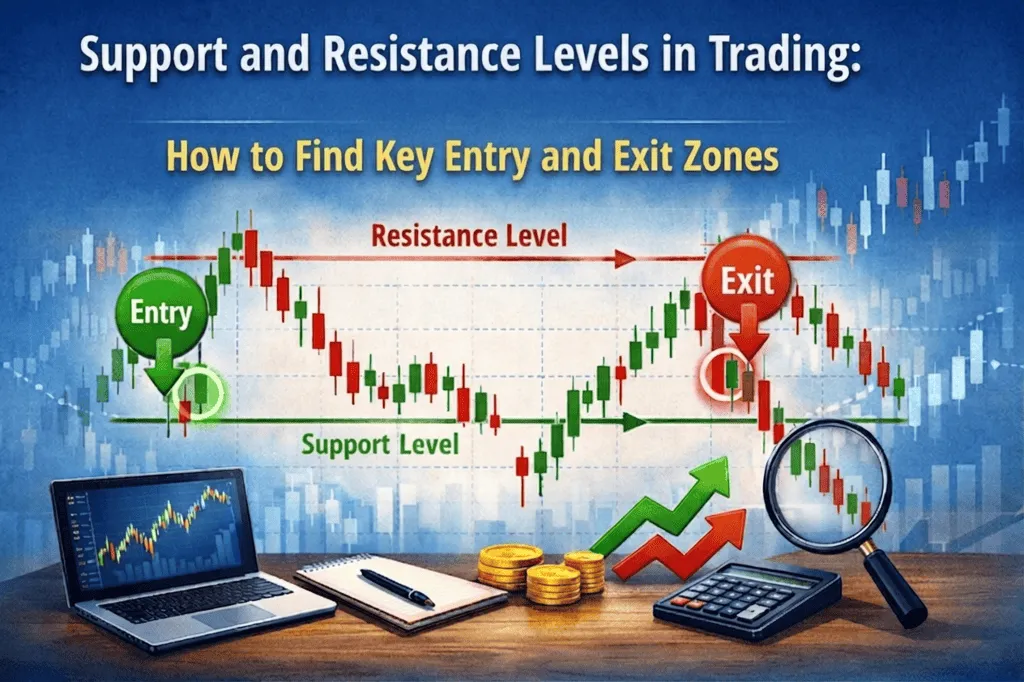
Every trader — from beginner to professional — eventually runs into the same question: why does price keep stopping at the same place? Why does an asset reverse at the same mark over and over, as if it hit an invisible wall? The answer lies in one of the foundational concepts of technical analysis — support and resistance levels. Without understanding these zones, it’s impossible to correctly identify entry and exit points, place a stop-loss, or assess your risk/reward ratio.
This article breaks down: how the support-and-resistance mechanism works at the level of market psychology and participant behavior; which methods and tools help you find strong price levels on a chart; how to build a trading strategy around these zones, accounting for breakouts, false breakouts, and bounces; and the mistakes beginner traders make when working with levels — and how to avoid them. This material covers classic Forex and stock markets as well as the crypto market, where support and resistance work on the same principles, with a few distinct twists.
- How Support and Resistance Work: The Mechanism Under the Hood
- How to Use Levels in Real Trading: Key Scenarios
- Step-by-Step Guide: How to Correctly Identify Support and Resistance Levels
- Tools for Identifying Levels: A Comparative Analysis
- Risks and Common Mistakes When Working with Support and Resistance
- Market Statistics and Level Effectiveness
- Current Trends in Working with Levels
- Conclusion: Putting This Knowledge into Practice
How Support and Resistance Work: The Mechanism Under the Hood
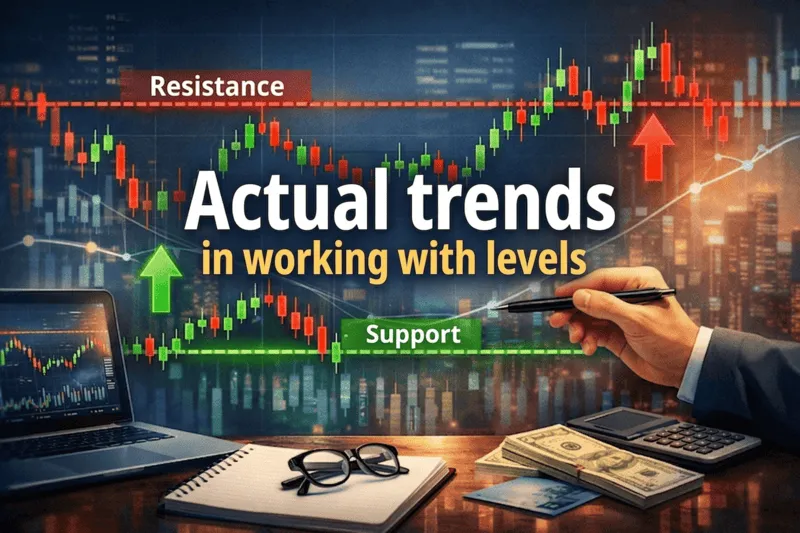
A support level is a price zone where buyer demand consistently outweighs seller supply. When price drops to that mark, enough buyers show up in the market to halt the downward move and push the quote back up. Resistance works as a mirror image: it’s a zone where seller supply overwhelms demand, and price reverses downward.
The main driver behind these zones is market participant psychology. Picture Bitcoin bouncing off $60,000 a few weeks ago. Traders who bought at that level remember it. When price approaches $60,000 again, three groups react: those who bought earlier and want to add to their position; those who missed the move and are ready to buy on the next touch; and those who sold too early and want back in. All three groups create combined demand that props up the price.
Resistance forms on a similar principle. Traders who bought the asset higher than the current price and are now sitting on a loss want to exit “at breakeven” once price returns to their entry point. That creates selling pressure in a specific zone. The more participants concentrated at one level, the stronger the support or resistance zone becomes.
It’s important to understand the role-reversal principle: when price breaks a resistance level and holds above it, that level becomes support. This is called “flipping” a level. The mechanism is simple: sellers who shorted at resistance end up at a loss after the breakout. When price returns to that zone, they want to close their losing positions — which creates demand and turns the former resistance into support. In the crypto market, this pattern is clearly visible around key Bitcoin and Ethereum levels.
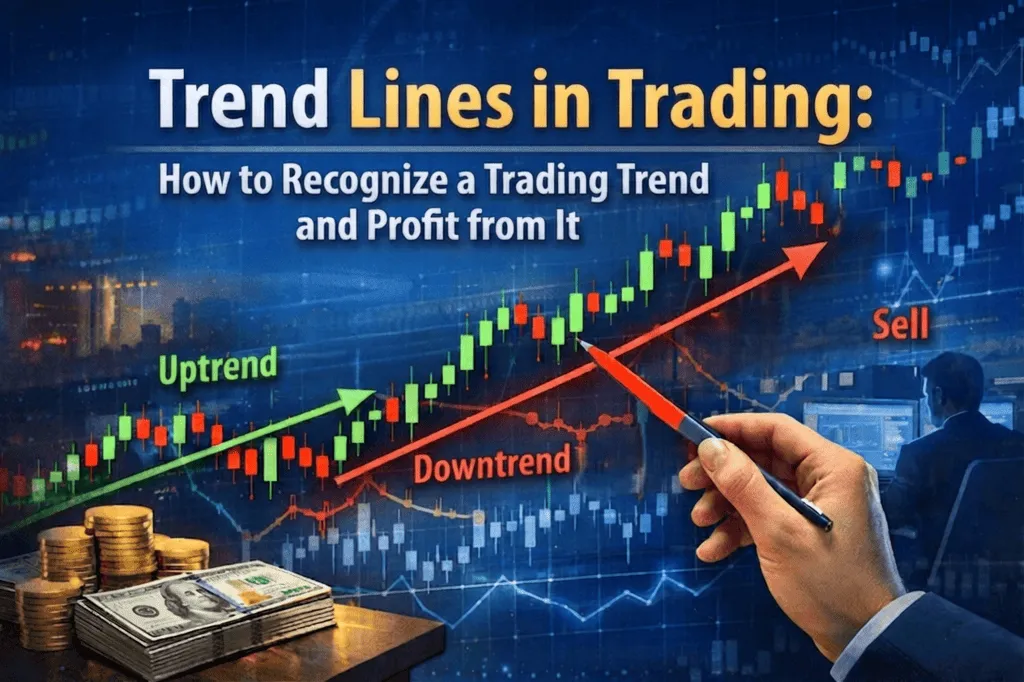
Horizontal lines are just one type of level. Trend lines (diagonal support and resistance), moving averages (like the 200-day MA), Fibonacci levels, and psychologically round numbers are all forms of support and resistance. When several of these tools point to the same zone, it’s considered especially significant and called a “level cluster.”
How to Use Levels in Real Trading: Key Scenarios
1. Bounce Trading
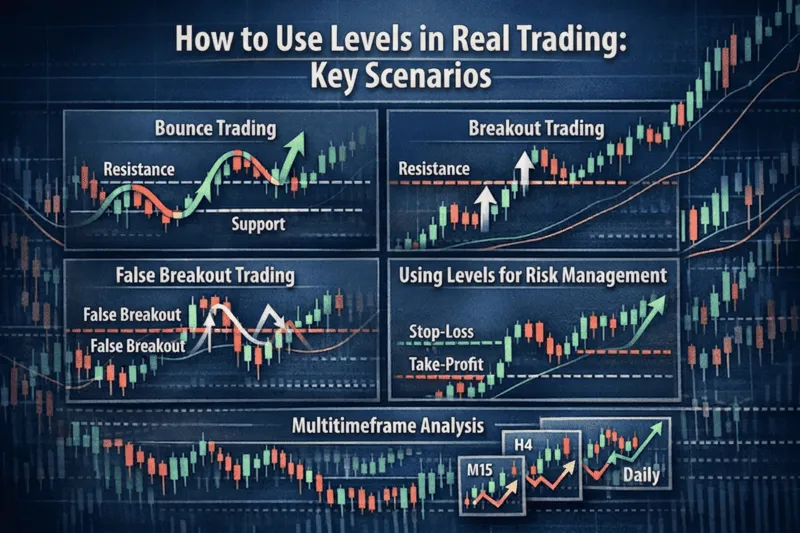
This is the classic, most popular scenario among traders. When price approaches a support level within an uptrend, a trader anticipates a reversal and opens a buy. The stop-loss goes just below the level with a small buffer (1–2%), and the take-profit sits at the nearest resistance. The same principle applies to selling at resistance. This scenario works especially well when price approaches the level after a sustained move showing signs of weakening momentum.
2. Breakout Trading
When price breaks a key resistance level on heavy volume, that signals a shift in the balance of power. A trader enters a buy after a candle closes above the level, or on a retest (when price returns to the former resistance, now turned support). This method delivers the best risk/reward ratio when trading a breakout of a strong level in the direction of the trend.
3. Trading a False Breakout
A false breakout is one of the most profitable, but also trickiest, situations. Price briefly breaks a level, sweeps up traders’ stop-losses, and then returns back inside. Large market participants deliberately engineer these moves. A trader who can recognize a false breakout through candle analysis (pin bars, engulfing patterns) and volume gets a high-quality entry point in the opposite direction.
4. Using Levels for Risk Management
Support and resistance levels define not just entry points, but a logical place for your stop-loss. Placing your stop right behind the level is a rookie mistake: it often gets “swept” by false breakouts. The professional approach: place your stop below the nearest support zone on a buy, or above the resistance zone on a sell, accounting for the candle’s average volatility range.
5. Multi-Timeframe Analysis
A level that’s significant on the daily timeframe is far stronger than a level on the hourly chart. Traders use a higher timeframe (weekly, daily) to identify key price zones, and a lower one (4H, 1H) to find the precise entry moment. When levels from different timeframes line up, the odds of a successful trade rise.
Step-by-Step Guide: How to Correctly Identify Support and Resistance Levels
Step 1. Choose your timeframe and asset.
Start with the weekly or daily chart. That’s where you see the most significant zones — the ones tested over months and years. For intraday trading or scalping in Forex and crypto, also study the 4-hour and hourly timeframes. A common beginner mistake: jumping straight to a 5-minute chart with no understanding of the higher-timeframe context.
Step 2. Find the obvious highs and lows.
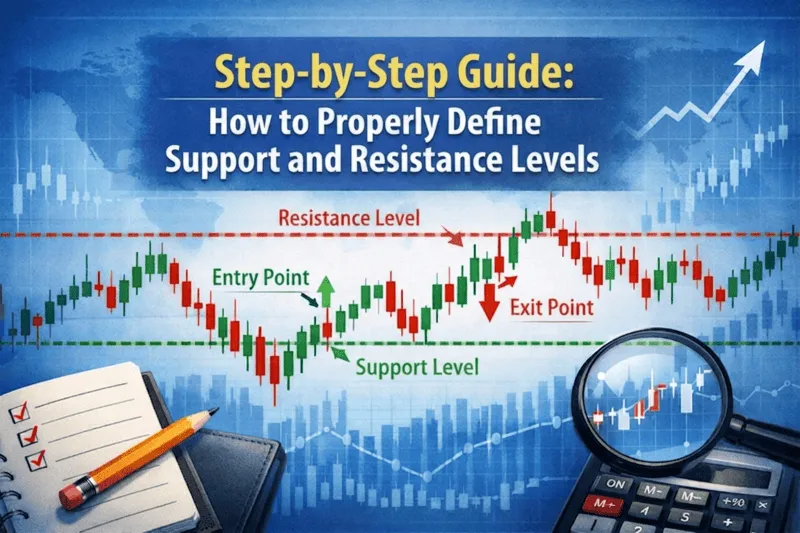
Mark the zones on the chart where price has reversed several times. One touch and reversal isn’t a level. A level forms from at least two or three touches. The more times price has bounced off a zone, the stronger the level. Look at historical highs and lows: they become powerful support or resistance zones going forward.
Step 3. Check the zone against volume.
A level is significant if it was historically accompanied by elevated trading volume. High volume means large market participants were actively trading in that zone — and are likely to return to it. On crypto exchanges, use Volume Profile, which shows how trading activity is distributed across price levels.
Step 4. Mark zones, not exact lines.
Draw a rectangle (a zone), not a thin line. The zone’s width depends on the asset’s volatility: for Bitcoin, that might be a range of several hundred dollars; for the EUR/USD pair, 20–50 pips. This helps you avoid exiting a trade prematurely on a minor violation of the level.
Step 5. Account for round numbers and psychological levels.
Marks like 1.2000 on Forex, $50,000 or $100,000 for Bitcoin, or $1,000 for a stock, are strong psychological barriers. A large number of buy and sell orders cluster around these numbers. They often coincide with technical levels, forming support or resistance clusters.
Step 6. Wait for a confirming signal.
Price simply approaching a level isn’t an entry signal on its own. Professional-level traders wait for confirmation: a reversal candle pattern (a hammer, a bullish engulfing candle), slowing price momentum, falling volume on approach and rising volume on the bounce. Entering with no confirmation as price breaks a key support zone is one of the most common causes of beginner losses.
Step 7. Set your stop-loss and target.
The moment you enter a trade, immediately place a protective stop. Size it based on market structure: your stop goes beyond the nearest significant extreme. Set your target at the next resistance zone on a buy. Your risk/reward ratio should be at least 1:2. If price hits your first target and the level holds, consider moving your stop to breakeven.
Tools for Identifying Levels: A Comparative Analysis

Different technical-analysis tools help you find support and resistance on a chart. Each has its own logic and use case. Below is a comparison of five core methods traders use.
| Tool | How It Works | Signal Strength | Best For | Complexity |
|---|---|---|---|---|
| Horizontal Levels | Historical highs/lows with multiple price touches | High | All markets and timeframes | Low |
| Trend Lines | Diagonal lines connecting consecutive extremes | Medium-High | Trending markets, Forex | Medium |
| Fibonacci Levels | 38.2%, 50%, 61.8% retracements of a significant move | Medium | Identifying retracements within a trend | Medium |
| Moving Averages (MA) | 200-MA, 50-MA as dynamic support/resistance | Medium | Trend trading, stock market | Low |
| Volume Profile | Price zones with the largest accumulated trading volume | High | Crypto, futures, intraday trading | High |
| Pivot Points | Calculated levels based on the previous session's prices | Medium | Day trading, scalping | Low |
Horizontal levels remain the foundation for most traders — they’re universal and work across every market. Volume Profile is gaining popularity among professionals trading crypto and futures: it shows the zones of greatest participant interest, not just chart geometry. Fibonacci levels are effective when paired with horizontal zones: when a 61.8% retracement lines up with a historical level, that’s a cluster with a high probability of playing out. For beginner traders, the optimal starting point is mastering horizontal levels and trend lines, gradually adding other tools from there.
Risks and Common Mistakes When Working with Support and Resistance
Mistake 1. Too Many Lines on the Chart
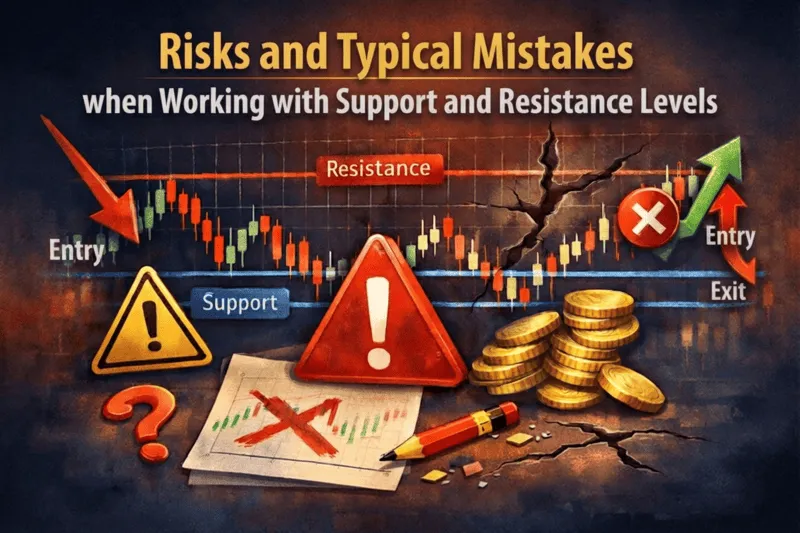
Beginners draw dozens of lines on every timeframe and end up seeing “levels” everywhere. This leads to chaotic trades and contradictory signals. The professional approach: identify 3–5 key zones on one timeframe and trade only from those. Fewer, more significant levels beat more, weaker ones.
Mistake 2. Ignoring the Trend Context
A support level in a downtrend behaves differently than one in an uptrend. In a downtrend, support levels regularly break, and resistance levels form lower than the previous ones. Trading a bounce off support against the trend is a low-probability strategy with poor mathematical expectation. Always evaluate price moves within the context of the broader trend.
Mistake 3. Entering with No Confirmation
Price approaching a level isn’t yet a signal. Price can break a level on the very first touch, especially if the move toward it was strong and impulsive. Entering after receiving a confirming signal (a candle pattern, an oscillator divergence, rising volume on the bounce) reduces the number of losing trades. In real trading, this rule gets broken more than any other.
Mistake 4. Placing the Stop-Loss Exactly at the Level
The market often dips just below an obvious support level, sweeps up stop-losses, and reverses. This is known as “stop hunting” or a liquidation move. If your stop sits right at the line, it’ll trigger more often than it should. A buffer of 0.5–2% makes the stop more resilient to brief price spikes.
Mistake 5. Neglecting the Higher Timeframe
A support level on a 15-minute chart might sit right inside a resistance zone on the daily chart. That trade is doomed from the start: the local level won’t hold up against global pressure. Before every trade, check the context on the higher timeframes — daily and weekly.
Market Statistics and Level Effectiveness

The Impact of Levels on Market Behavior
Research into trading systems in the Forex and crypto markets shows: trades opened at significant horizontal levels with a confirming signal show accuracy in the range of 55–65%. That might not sound like much at first glance — but with a risk/reward ratio of 1:2 or 1:3, it delivers positive mathematical expectation even with half your trades losing.
Trading Volume at Key Levels
According to crypto-exchange analysis from 2024–2025, zones with the largest accumulated volume (the Point of Control in Volume Profile) played out as support or resistance in 70–75% of cases. For Bitcoin, the most significant psychological levels turned out to be $30,000, $50,000, and $100,000 — each of them halted price movement at least twice.
The Frequency of Breakouts and False Breakouts
Trading-platform statistics show that 30% to 40% of key-level breakouts turn out to be false. That means price closes beyond the level, then returns back inside within 1–3 candles. That’s exactly why professional traders wait for a breakout to be confirmed by several candle closes above/below the level, rather than reacting to the first touch.
Effectiveness Across Different Timeframes
Higher-timeframe levels (weekly, daily) play out more reliably than lower-timeframe ones (1H and below). The accuracy gap runs 10–15 percentage points according to comparative trading-strategy tests. For long-term investors working with stocks or crypto, weekly and monthly levels hold the most value for identifying position-accumulation zones.
Current Trends in Working with Levels
The Spread of Algorithmic Trading
Today, algorithmic systems generate a significant share of volume in crypto and Forex markets. That makes key support and resistance levels even more significant: bots get programmed to trade off obvious price zones. The consequence: levels play out faster and more precisely, but the number of false breakouts algorithms create to sweep up liquidity has also grown.
Volume Profile Integrated into Standard Platforms
In 2024–2025, Volume Profile became available in standard TradingView tools and most crypto platforms with no extra fee. That opened up access to volume analysis for a broad audience of traders. Combining horizontal levels with Volume Profile data lets you find support and resistance zones with significantly higher precision.
Liquidity Levels as an Advanced Approach
The Smart Money Concepts (SMC) framework reinterprets traditional levels through the lens of liquidity. Under this methodology, support and resistance zones are viewed as “liquidity pools” — clusters of stop orders that large market participants deliberately target to build positions. The SMC methodology has actively spread through the trading community in 2025–2026 and pairs well with the classical approach to levels.
The Growing Importance of Psychological Levels in Crypto
After Bitcoin reached $100,000 in late 2024, round psychological numbers took on an even more important role in crypto-market analysis. The $50,000, $80,000, $100,000, and $120,000 levels work as powerful support and resistance zones, drawing enormous order volume from retail traders and institutional participants alike.
Conclusion: Putting This Knowledge into Practice

Support and resistance levels aren’t magic, and they aren’t a self-fulfilling prophecy. They’re a reflection of genuine buyer and seller behavior, their memory of past prices, and their willingness to act when price returns to them. Understanding this mechanism gives a trader an analytical edge over anyone trading “blind.”
For beginners: start by practicing identifying horizontal levels on the daily chart. Pick one asset, mark 3–4 key levels, and observe for a few weeks — that’s the best way to get a feel for how the mechanism works. Only then move on to actively trading from levels.
For experienced traders: add Volume Profile to your analysis to find zones of accumulated volume, study the liquidity-zone concept within SMC, and always check trades from a lower timeframe against the context of a higher one.
Regardless of experience level: work with levels alongside risk management. Even the most precise analysis doesn’t guarantee a 100% result — proper position sizing and discipline in executing your trading strategy do.
Keep up with new material on PropTradingRank.com: the site regularly publishes breakdowns of specific trading situations, technical-analysis tool reviews, and practical guides for building trading systems.
Frequently Asked Questions
What's the difference between a support level and a support zone?
A level is a specific price or a horizontal line on a chart. A zone is a price range where trading activity concentrates. In practice, it's more accurate to work with zones: price rarely reverses to the exact pip, so a rectangular area on the chart gives a more realistic picture of market behavior in that spot.
How many times does price need to touch a level for it to become significant?
A minimum of two or three touches with a price reversal. One touch is coincidence. Two or three is a pattern. The more touches, and the higher the timeframe, the stronger the level. A level price has bounced off five times on the daily chart carries far more weight than one touched twice on the hourly.
Why do levels sometimes not work?
A level stops working when the market's fundamental context shifts: major news breaks, central bank monetary policy changes, regulatory events hit crypto. Technical analysis describes market behavior under normal conditions. Force-majeure events break through even the strongest levels. That's exactly why a stop-loss is a mandatory part of every trade.
How do you determine the strength of a level?
A level's strength is determined by several factors: the number of touches and reversals, trading volume in that zone, the timeframe (daily is stronger than hourly), alignment with a round psychological number, and alignment with a Fibonacci level or moving average. The more factors pointing to the same zone, the more significant it is.
Can you use support and resistance for crypto trading?
Yes, the principles work in any liquid market: Forex, stocks, commodity futures, crypto. In the crypto market, levels play out somewhat more dynamically due to high volatility and a large share of retail traders. Round psychological numbers ($50,000, $100,000 for Bitcoin) carry particular significance in this market.
What does "flipping" a level mean?
When price breaks a resistance level and holds above it, the former resistance becomes support. The reverse also happens: broken support becomes resistance. This is one of the basic principles of technical analysis. Trading a retest of a flipped level is a high-quality signal with a good risk/reward ratio.
Should you factor in volume when analyzing levels?
Volume is an important supporting factor. A level formed on high trading volume is more reliable than one formed during low activity. When a level breaks, volume confirms whether the breakout is genuine: high volume means real trades from market participants are behind the move, not a false spike.
Which timeframe is best for drawing levels?
It depends on your trading style. Long-term investors and swing traders draw their core levels on the weekly and daily chart. Day traders use the daily and 4-hour. Scalpers work with the 1-hour and 15-minute, but always accounting for higher-timeframe context. The optimal approach is multi-timeframe analysis, making decisions based on the daily chart.
Related Articles:















- How Support and Resistance Work: The Mechanism Under the Hood
- How to Use Levels in Real Trading: Key Scenarios
- Step-by-Step Guide: How to Correctly Identify Support and Resistance Levels
- Tools for Identifying Levels: A Comparative Analysis
- Risks and Common Mistakes When Working with Support and Resistance
- Market Statistics and Level Effectiveness
- Current Trends in Working with Levels
- Conclusion: Putting This Knowledge into Practice

Top 10 Best Prop Firms
| # | Prop Firm | Rating | Assets | Profit Split | Funded Capital | Challenge Fee | Founded | Promo Code | Website |
|---|---|---|---|---|---|---|---|---|---|
|
1
|
4.9
|
Crypto, Stocks, Indices, Metals, Energy
|
Up to 90% | Up to $200,000 | From $79 | 2023 |
20% discount
RANK20
|
Visit Website | |
|
2
|
4.8
|
Crypto, Forex
|
Up to 90% | Up to $200,000 | From $99 | 2023 |
20% discount
RANK20
|
Visit Website | |
|
3
|
4.7
|
Prediction Markets, Polymarket
|
Up to 90% | Up to $50,000 | From $30 | 2026 |
25% discount
RANK25
|
Visit Website | |
|
4
|
4.7
|
Crypto, Forex, Other Assets
|
Up to 90% | Up to $200,000 | From $59 | 2024 |
10% discount
Follow the link
|
Visit Website | |
|
5
|
4.7
|
Crypto
|
Up to 90% | Up to $200,000 | From $59 | 2023 |
10% discount
Follow the link
|
Visit Website | |
|
6
|
4.6
|
Crypto, Forex, Stocks, Indices, Metals, Energy
|
80%–100% | Up to $200,000 | From $49 | 2026 |
30% discount
RANK30
|
Visit Website | |
|
7
|
4.6
|
Forex, Stocks, Indices, Metals
|
Up to 90% | Up to €300,000 | From €40 | 2023 |
30% discount
RANK30
|
Visit Website | |
|
8
|
4.5
|
Crypto, Forex, Indices, Metals
|
80%–100% | Up to $200,000 | From $89 | 2013 |
No Promo Code
|
Visit Website | |
|
9
|
4.5
|
Crypto, Forex
|
Up to 90% | Up to $200,000 | From €79 | 2015 |
No Promo Code
|
Visit Website | |
|
10
|
4.3
|
Crypto, Forex, Other Assets
|
60%–95% | Up to $200,000 | From $32 | 2024 |
20% discount
HELLO
|
Visit Website |