



Indicators in Trading: Types and What to Watch For

Every trader eventually runs into the same question: how do you tell a random price move from a genuine signal? Trading indicators are mathematical tools that process historical price, volume, and time data to help a trader make more informed decisions. They don’t predict the future, but they significantly cut down the influence of emotion on trading and give you a structured framework for market analysis.
This article covers: the main types of trading indicators and how they work; how to correctly choose technical-analysis tools for your strategy; a comparison table of popular indicators rated for different markets; the real risks of using indicators that usually go unmentioned; and the current 2024–2025 trends reshaping how people approach chart analysis. If you want to trade with a clear head, read on.
- How Technical Analysis Indicators Work
- Types of Indicators: Core Categories and How They’re Used
- How to Start Using Trading Indicators: A Step-by-Step Guide
- Comparing Popular Forex and Crypto Indicators
- The Risks and Limitations of Indicators: What to Know Before You Trade
- Statistics and Data: How Effective Are Market Indicators
- Current Trends: How Market Analysis Is Changing
- Conclusion: How to Choose and Use Indicators Effectively
How Technical Analysis Indicators Work
At the core of every indicator is a formula that takes price data (open, close, high, low) and trading volume, then converts it into an understandable visual signal. That could be a line on the chart, a histogram, a numeric value, or a zone. The trader isn’t looking at raw quote data, but already-processed information — a kind of “dashboard” for the market.
Take a simple moving average (SMA). The platform adds up closing prices over the chosen period — say, the last 20 candles — and divides the sum by that number. The result is one point. Connect enough of these points, and you get a line that smooths out price noise and shows the overall direction of movement. If price trades above the SMA, the market is considered to be in an uptrend; if below, a downtrend.
The exponential moving average (EMA) works on the same principle, but gives more weight to recent prices. That makes it more responsive to the current situation. That’s exactly why many professional Forex and crypto traders prefer EMA in short-term strategies — it reacts to a trend reversal faster than the classic SMA.
RSI (the Relative Strength Index) works differently. This oscillator measures the speed and magnitude of price changes over a chosen period (typically 14 candles). RSI ranges from 0 to 100. When the indicator rises above 70, the asset is considered overbought — meaning the rally may slow down or reverse. When it drops below 30, the market is oversold, which often precedes an upward correction. That’s not a guarantee, but it’s an important clue.
MACD (Moving Average Convergence/Divergence) combines trend and momentum properties. The indicator plots a line based on the difference between the 12- and 26-period EMAs, then adds a signal line — a 9-period EMA of that main line. Traders treat a crossover between these two lines as a buy or sell signal. The MACD histogram shows how far apart the lines have moved — the bigger the gap, the stronger the current momentum.
Bollinger Bands add volatility to the analysis. The indicator draws three lines: a middle line (typically a 20-period SMA) and two bands set two standard deviations above and below it. When price approaches the upper band, the asset is trading expensive relative to its recent history. A narrowing of the bands (known as a “squeeze”) signals falling volatility and often precedes a sharp price move in one direction or the other.
Types of Indicators: Core Categories and How They’re Used
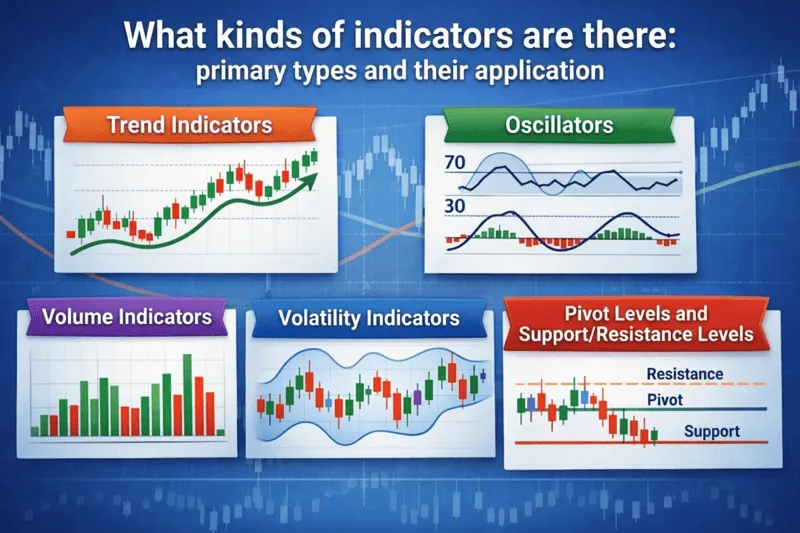
Every market indicator falls into one of several categories depending on exactly what it analyzes. Understanding these categories helps you build a balanced trading toolkit, rather than using different tools that all duplicate the same signal.
Trend Indicators
These are tools that identify market direction. They work best in trending markets and produce plenty of false signals in a sideways range. This group includes moving averages (SMA, EMA), MACD, ADX (the Average Directional Index), and Ichimoku Cloud. Traders use them to find an entry point within an already-established trend, not to predict a reversal.
Oscillators
Oscillators measure the strength and momentum of a price move. They fluctuate within a fixed range and are especially useful in sideways markets. RSI, Stochastic, and CCI (the Commodity Channel Index) are all oscillators. When the market enters an overbought or oversold zone according to these tools, traders start looking for signs of a reversal or correction.
Volume Indicators
Volume is one of the most underrated parameters. It shows how much of an asset was bought and sold over a given period. Volume indicators (OBV, Volume Profile, CMF) help confirm or refute price signals. Rising price on falling volume often signals a weak move; rising price on high volume signals strength. Without volume analysis, a trader only sees half the picture.
Volatility Indicators
This category analyzes how actively price is moving. Bollinger Bands, ATR (Average True Range), and the Keltner Channel are tools that answer the question, “how wide is the trading range right now?” Traders use ATR to size a stop-loss so it matches current market volatility, rather than a fixed number of points.
Pivot Points and Support/Resistance Levels
Technically, these aren’t indicators in the classic sense, but most trading platforms offer them in the same section. They’re calculated off the high, low, and close of the previous session and show key price zones where the market has historically changed direction. These levels often work as entry points for short- and medium-term trades.
How to Start Using Trading Indicators: A Step-by-Step Guide
Step 1. Define your trading style.
Before opening your platform, answer the question: what time horizon are you trading? Scalpers work on 1-minute and 5-minute charts, day traders on hourly charts, swing traders on daily charts. Indicators for intraday trading get set up with short periods (EMA 9/21, RSI 7–9). For longer-term positions, longer periods are used (SMA 50/200, RSI 14). A common mistake is applying tools built for one timeframe on another.
Step 2. Choose a platform with the right tools.
Most modern trading platforms — MetaTrader 4/5, TradingView, cTrader, ATAS — come with several hundred built-in indicators. TradingView also offers thousands of custom scripts written in Pine Script. Start with a basic set and don’t overload your screen. Three or four well-understood tools will deliver better results than ten you don’t fully grasp.
Step 3. Study each indicator on historical data.
Before trading real money, scroll back through historical charts 200–300 candles. Watch how the indicator behaved during trending stretches and during sideways moves. Find the conditions under which it gave accurate signals, and the conditions under which the signals turned out false. This is called backtesting, and it’s critically important before any real trading.
Step 4. Write clear entry and exit rules.
Indicators only work when a trader defines the rules in advance. Not “I’ll buy if RSI drops,” but “I’ll open a long position if RSI drops below 30, price touches a support level, and the candle closes above it.” Vague rules are the cause of most losing trades. Specificity helps you make decisions with no emotion involved.
Step 5. Test your strategy on a demo account.
A demo account isn’t just for “playing around.” It’s a genuine testing environment for your strategy with no financial risk. Trade demo for at least 4–6 weeks, logging every trade: why you opened it, what the signal was, and the outcome. After 50–100 trades, you’ll have statistics to rely on. Skip this stage, and moving to real money is basically gambling.
Step 6. Set your risk-management rules.
No indicator protects you from losses — it only raises the odds of a successful trade. That’s why every strategy needs clear risk parameters attached: a maximum stop-loss size (calculated via ATR), a maximum percentage of your deposit per trade (typically 1–2%), and a rule for stopping after a losing streak. Risk management matters more than the most profitable signal.
Step 7. Move to a real account gradually.
Start with the minimum lot size. Even if your demo results look good, the psychology of real money works differently. Emotions influence decisions far more strongly when real capital is on the line. Trade with minimal risk for your first two or three months, only scaling up positions once you’ve confirmed you can stick to your strategy’s rules under real market conditions.
Comparing Popular Forex and Crypto Indicators
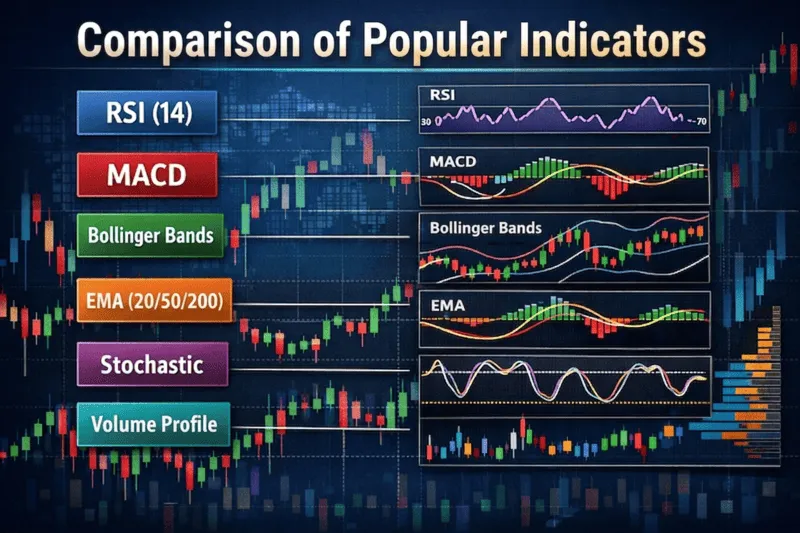
Below is a structured comparison of six of the most widely used trading tools. This table helps you understand which indicator fits a specific trading style and market type.
| Indicator | Type | Best Used For | Best Market | Skill Level |
|---|---|---|---|---|
| RSI (14) | Oscillator | Overbought/oversold zones | Forex, crypto, stocks | Beginner |
| MACD | Trend | Trend strength, signal-line crossovers | Forex, stock market | Intermediate |
| Bollinger Bands | Volatility | Price range, squeeze/expansion | Forex, crypto | Intermediate |
| EMA (20/50/200) | Trend | Trend direction, support levels | All markets | Beginner |
| Stochastic | Oscillator | Reversal points, price momentum | Forex, stocks | Beginner |
| Volume Profile | Volume | Key price levels by volume | Futures, crypto | Advanced |
RSI and Stochastic are the optimal choice for beginners: intuitive and delivering clear signals in overbought and oversold zones. MACD suits traders with basic experience who know how to read trend momentum. Bollinger Bands work well paired with RSI: one tool shows the price range, the other confirms the entry moment. Volume Profile is a tool for advanced traders who analyze the market through the lens of liquidity.
It’s important to note that professional traders rarely rely on just one tool. Combining EMA + RSI + Volume delivers more reliable signals than any of them individually. This table reflects the basic characteristics; specific settings get tailored to the market and timeframe.
The Risks and Limitations of Indicators: What to Know Before You Trade

1. Every indicator lags.
This isn’t a flaw of any specific tool — it’s a mathematical inevitability. Every indicator is built on historical data, meaning the signal appears after the move has already started. A 200-period EMA might confirm a trend change once the market has already covered 30–40% of the new move. The longer the period, the greater the lag. That doesn’t make these tools useless, but it demands the right approach to timing your entry.
2. False signals in sideways markets.
Trend indicators — MACD, moving averages — produce plenty of false crossovers when the market moves within a range with no clear direction. A trader following every EMA signal during a flat market loses money on a series of small losses. The fix: add a filter, such as requiring ADX above 25 as a condition for opening a position on a trend signal.
3. Indicator overload.
Beginners often pile 8–10 tools onto their chart, hoping more signals mean more accuracy. In practice, this leads to “analysis paralysis”: indicators contradict each other, and the trader can’t make a decision. The optimal set is 2–4 tools, each solving a specific job: identifying the trend, measuring the strength of the move, and evaluating the entry moment.
4. Curve-fitting to history.
Backtesting can be deceptive if a trader tunes an indicator’s parameters to fit past data. RSI(7) with 25/75 levels might work beautifully on one specific historical stretch but fail on the live market. This is called overfitting. Test your strategy on data that wasn’t used during development — this is known as forward testing.
5. Indicators don’t account for fundamental news.
Technical analysis works as long as the market moves on its own momentum. Inflation data releases, a central bank rate decision, an unexpected geopolitical event — all of these instantly break any technical picture. A trader needs to know the economic calendar and either close positions ahead of key news or widen their stop-loss to account for the potential volatility.
Statistics and Data: How Effective Are Market Indicators

Indicator Popularity Among Traders
According to the TradingView platform, which has more than 50 million users, moving averages (MA/EMA/SMA) rank among the top three most-added indicators across every asset class. RSI consistently holds the position of the most popular oscillator. A 2023 Investopedia study found that around 74% of active retail traders use at least one technical indicator in their trading strategy.
Signal Accuracy: What to Expect
Academic research (notably the work of Brock, Lakonishok, and LeBaron, who tested moving-average-based strategies on 90 years of data) has shown that simple technical rules can deliver above-random results in trending markets. In efficient markets, though (most large-cap stocks during calm periods), that edge gets wiped out by transaction costs. The real accuracy of MACD trend signals in Forex averages 45–55% — just slightly better than a coin flip. A strategy’s profitability comes not from the frequency of correct entries, but from the risk/reward ratio.
The Size of the Technical Analysis Software Market
The technical-analysis software market was valued at $1.4 billion in 2023 and, according to MarketsAndMarkets forecasts, will grow to $2.9 billion by 2028. That reflects growing demand for algorithmic analysis tools among both retail and institutional participants. The crypto segment accounts for a significant share of that growth, as exchanges roll out built-in technical-analysis tools to compete for retail traders.
The Impact of Timeframe on Results
Research by IG Group analysts across a sample of 40,000 accounts found that traders working on daily and weekly charts, on average, show better results than scalpers working on minute-level timeframes. This is because signals on higher timeframes contain less noise. That said, short-term strategies with clear risk-management rules can also be profitable — the difference comes down to discipline and transaction costs.
Current Trends: How Market Analysis Is Changing
AI Indicators and Machine Learning
Traditional indicators are built on fixed mathematical formulas. Modern algorithmic systems use neural networks that independently identify patterns based on hundreds of parameters. Platforms like QuantConnect, Kensho, and various AI-trading startups offer tools that adapt to changing market conditions — something a classic MACD simply can’t do. For retail traders, this is more of a future direction than a readily accessible tool right now, but the trend is clear.
Order Flow and Order Book Analysis
More and more traders are supplementing classic indicators with order-flow-based technical analysis. Tools like footprint charts, delta, and cumulative delta show exactly who’s buying and selling at a given moment — aggressive buyers or sellers. This direction has become especially popular among futures traders and crypto market participants. ATAS and Sierra Chart hold leading positions in this segment.
Integrating Indicators with Alerts and Automation
TradingView and MT5 let you set up automatic notifications when an indicator condition triggers: RSI dropped below 30, price touched the 200-period EMA, volume exceeded the 20-period average. This functionality frees traders from constantly staring at the screen and lets them focus on decision-making rather than monitoring. In 2024–2025, integrating signals with Telegram bots and trading robots has become standard practice.
Growing Popularity of Multi-Timeframe Analysis
Professional traders are increasingly analyzing multiple time horizons at once. The core idea: identify the trend on a higher timeframe (daily, weekly), find the entry point on a lower one (hourly, 15-minute). Indicators are applied at each level, checking that signals line up across timeframes. TradingView added a “multi-timeframe indicator” feature — the ability to display an indicator’s value from a different timeframe right on your current chart, significantly simplifying this kind of analysis.
Conclusion: How to Choose and Use Indicators Effectively
Technical-analysis indicators aren’t magic, and they aren’t ready-made trading signals. They’re tools that help structure market information and support more informed decisions. They work in combination with clear entry/exit rules, risk management, and an understanding of exactly what’s being analyzed.
For beginners: start with two or three tools — EMA to identify the trend, RSI to gauge the entry moment, and simple support and resistance levels. That’s enough for your first steps. For experienced traders: look into volume indicators and order flow — they’ll give you a fundamentally new perspective on price movement. For everyone: never skip backtesting and demo trading before moving to real capital.
If technical analysis interests you, keep up with new material on PropTradingRank.com — you’ll find practical trading-strategy guides, indicator breakdowns, and current market reviews here.
Frequently Asked Questions
Which indicator is best for beginners?
RSI (14-period) is the optimal starting point for a beginner. It shows overbought zones (above 70) and oversold zones (below 30) as a simple number from 0 to 100. It's easy to pair with a single moving average (50-period EMA) to identify overall direction — and you already have a basic working combination.
How many indicators should you use at once?
The optimal number is 2–4 tools from different categories (trend, oscillator, volume). More than that creates informational noise and contradictory signals. Professional traders often work with 2–3 indicators and a clean price chart.
Do indicators work in the crypto market?
Yes, classic technical-analysis tools apply to crypto the same way they do to Forex or the stock market. That said, you need to account for crypto's elevated volatility: standard settings (like RSI 14 with 30/70 levels) may generate fewer signals during sharp moves. Traders often adapt the levels to 20/80 for more volatile assets.
Can you trade using only indicators, with no chart analysis?
Technically, yes — and some algorithmic systems do exactly that. But for manual trading, combining price-action analysis with indicators delivers better results. An indicator confirms what's already visible on the chart, which reduces the number of false entries.
Why did an indicator that used to work stop delivering results?
Market conditions change. An indicator tuned for the trending market of 2021 might perform poorly in the sideways market of 2023. Regularly review your parameters and check whether your chosen tool still matches the current market structure.
What is indicator divergence, and why does it matter?
Divergence is a mismatch between the direction of price and the direction of the indicator. For example, price makes a new high, but RSI doesn't. That's a signal of weakening trend and a possible reversal. Divergence is considered one of the most reliable signals in technical analysis, especially on higher timeframes.
How do you correctly configure an indicator's parameters?
Start from the standard settings (RSI 14, MACD 12/26/9, BB 20/2) and adapt them to your timeframe and asset through backtesting. Periods that are too short produce lots of false signals; periods that are too long lag behind. The golden rule: change one parameter at a time and check the result against at least 100 historical trades.
Are paid indicators better than free ones?
Not necessarily. Most effective strategies are built on a platform's standard built-in tools. Paid indicators often offer nicer visualization and automatic alerts, but the underlying math is the same. Before paying for one, make sure you've mastered the basic free toolkit.
Related Articles:










- How Technical Analysis Indicators Work
- Types of Indicators: Core Categories and How They’re Used
- How to Start Using Trading Indicators: A Step-by-Step Guide
- Comparing Popular Forex and Crypto Indicators
- The Risks and Limitations of Indicators: What to Know Before You Trade
- Statistics and Data: How Effective Are Market Indicators
- Current Trends: How Market Analysis Is Changing
- Conclusion: How to Choose and Use Indicators Effectively

Top 10 Best Prop Firms
| # | Prop Firm | Rating | Assets | Profit Split | Funded Capital | Challenge Fee | Founded | Promo Code | Website |
|---|---|---|---|---|---|---|---|---|---|
|
1
|
4.9
|
Crypto, Stocks, Indices, Metals, Energy
|
Up to 90% | Up to $200,000 | From $79 | 2023 |
20% discount
RANK20
|
Visit Website | |
|
2
|
4.8
|
Crypto, Forex
|
Up to 90% | Up to $200,000 | From $99 | 2023 |
20% discount
RANK20
|
Visit Website | |
|
3
|
4.7
|
Prediction Markets, Polymarket
|
Up to 90% | Up to $50,000 | From $30 | 2026 |
25% discount
RANK25
|
Visit Website | |
|
4
|
4.7
|
Crypto, Forex, Other Assets
|
Up to 90% | Up to $200,000 | From $59 | 2024 |
10% discount
Follow the link
|
Visit Website | |
|
5
|
4.7
|
Crypto
|
Up to 90% | Up to $200,000 | From $59 | 2023 |
10% discount
Follow the link
|
Visit Website | |
|
6
|
4.6
|
Crypto, Forex, Stocks, Indices, Metals, Energy
|
80%–100% | Up to $200,000 | From $49 | 2026 |
30% discount
RANK30
|
Visit Website | |
|
7
|
4.6
|
Forex, Stocks, Indices, Metals
|
Up to 90% | Up to €300,000 | From €40 | 2023 |
30% discount
RANK30
|
Visit Website | |
|
8
|
4.5
|
Crypto, Forex, Indices, Metals
|
80%–100% | Up to $200,000 | From $89 | 2013 |
No Promo Code
|
Visit Website | |
|
9
|
4.5
|
Crypto, Forex
|
Up to 90% | Up to $200,000 | From €79 | 2015 |
No Promo Code
|
Visit Website | |
|
10
|
4.3
|
Crypto, Forex, Other Assets
|
60%–95% | Up to $200,000 | From $32 | 2024 |
20% discount
HELLO
|
Visit Website |